Dude, where's my memory?!
- It starts with a customer report
- Reproducer
- The investigation
- And they lived happily ever after
- Conclusion
It starts with a customer report
Recently, I received a report from a customer that they noticed RSS slowly growing over time in their application when they enable Datadog Java Profiler. There is no unexpected growth in heap usage, meaning that it is the native memory usage that is growing. Oh well, I should brace for a fun debugging session.
Reproducer
Quite expectedly, the customer was not able to share their application with me, so I have to come up with a reproducer. From the problem description there was nothing extraordinary with the application, yet our continuous reliability tests did not catch the issue. Usually, when I have no idea where to start, I reach out to the Renaissance Benchmark which provides a nice collection of diverse load generating cases. As luck wanted it, the Akka-uct benchmark was the first one I tried, and it exhibited the same behavior as the customer’s application. The RSS was growing quite visible with the interpolated rate of 60-70MiB per day but the Java heap usage was rather stable.
The investigation
Native Memory Tracking
The first thing I did was to enable the native memory tracking (NMT) and check the JVM native memory statistics. Unfortunately, the NMT did not show anything suspicious. The usage of the native memory managed by JVM stayed stable, which was not the case with the RSS.
ASAN
Ruling out the JVM managed native memory issues I refocused on our profiler library which is a native JVMTI agent and therefore can cause unexpected memory leaks at the native side. The AddressSanitizer (ASAN) is a great tool to catch such issues. It is touted as the ‘go-to’ tool for the native memory issues debugging. I compiled and linked the agent with ASAN enabled and ran the reproducer. Boom! It turns out that ASAN is very sensitive to SIGSEG (among other signals) and aborts analysis as soon as it discovers one. The profiler library is a JVM agent and is running inside the JVM process. And the JVM is using SIGSEG for internal signalling. To make things more interesting, the profiler library is relying on being able to handle SIGSEG when attempting to read potentially invalid memory - we are effectively peeking in the JVM internals, and we need to be very defensive there as it was not designed with this level of observability in mind.
There is a config option telling ASAN to ignore SIGSEGs, but it did not work for the LeakSanitizer (LSAN) subsystem.
Bottom line, ASAN is not an option for this case.
Valgrind
After the fiasco with ASAN, I turned to Valgrind. Valgrind is a bit more intrusive than ASAN, but it
is also more flexible. And you don’t need to modify the build process to use it. One can just take the already existing debug
build and run it under Valgrind using the memcheck tool.
Ok, let’s try this out. Fingers crossed!
Hm, it’s slow. I mean, really, really slow … but it seems to be working. After a long while I had my first Valgrind report. Unfortunately, it was totally swamped by warnings caused by the GC managing memory in ways Valgrind does not like. It is possible to configure the checks with the help of suppressions, but it is a tedious process. After a few more rounds of running the reproducer, waiting for the report, and tweaking the suppressions, I gave up. The amount of noise was just too high to be able to see the signal. Even with most of the nonsensical warnings suppressed, it gives literally thousands of leak suspects which are most probably not leaks at all, coming from GC or runtime itself.
==315313== LEAK SUMMARY:
==315313==    definitely lost: 20,029 bytes in 354 blocks
==315313==    indirectly lost: 114,141 bytes in 2,215 blocks
==315313==      possibly lost: 60,961,787 bytes in 244,974 blocks
==315313==    still reachable: 29,620,688 bytes in 3,188 blocks
==315313==        suppressed: 0 bytes in 0 blocks
I took L for Valgring as well. But wait, there is this tool in the Valgrind package, ‘massif’ which can be used to profile the heap usage. But no, false alarm. Running the rerpoducer with ‘massif’ will just take down the JVM with SIGSEG within a minute.
DDPROF
When the standard solutions failed, it is time to try some dog-food. The DDPROF
(Datadog Profiler for native code) contains a new beta feature called ‘live heap profiler’. The live heap profiler samples
OS level memory allocations (eg. via malloc or new) and tracks when the allocated chunks are released.
Subjectively, it is much faster than Valgrind (can’t compary to ASAN as it did not work for me) and should be able to
capture sufficiently prominent memory leaks.
The live heap profiling feature is currently available only in version 0.17.0 of DDPROF and once that version is downloaded and extracted it can be used like this:
ddprof -S akka-uct-jdk11-notrace-native -e sALLOC,mode=l --inlined_functions true -worker_period 300000 \
  java -Ddd.env=${WORKSPACE} -Ddd.service=akka-uct-jdk11-notrace \
  -Ddd.profiling.enabled=true -Ddd.profiling.ddprof.enabled=true \
  -Ddd.profiling.ddprof.liveheap.enabled=true -Ddd.profiling.ddprof.alloc.enabled=true -Ddd.profiling.upload.period=10 \
  -Ddd.profiling.timeline.events.enabled=true -Ddd.integration.renaissance.enabled=true -Ddd.env=memleak-test \
  -Ddd.trace.enabled=false \
  -Xmx512m -jar renaissance-mit-0.15.0.jar akka-uct -r 1000000
The important part is ddprof -S akka-uct-jdk11-notrace-native -e sALLOC,mode=l --inlined_functions true -worker_period 300000
which configures the DDPROF to track allocation with liveness information (-e sALLOC,mode=l), resolve inlined function (--inline_functions true)
and to effectively not evacuate the liveness tracking table(-worker_period 300000). If the -worker_period is not specified
the liveness tracking table will be regularly evacuated in order to prevent secondary memory leaks in the DDPROF itself
(if an allocation is not released in the profiled application, the tracking entry in DDPROF would live forever without the
evacuation).
The rest of the command is just a standard configuration of both the native and Java specific profiler.
Having finished the setup in no time, I run the reproducer and keep it running for at least a few hours. The results are interesting. As I already mentioned, this is a great example of dog-fooding. Using the Datadog DDPROF tool to capture profiles that can then be analyzed in the Datadog platform. Once all the data is in, I can use the comparison feature of the Datadog Continuous Profiler to compare the sample of live allocations at the beginning of the run with the sample at the end of the run. Here is the result:
Fig1: Live heap profile comparison
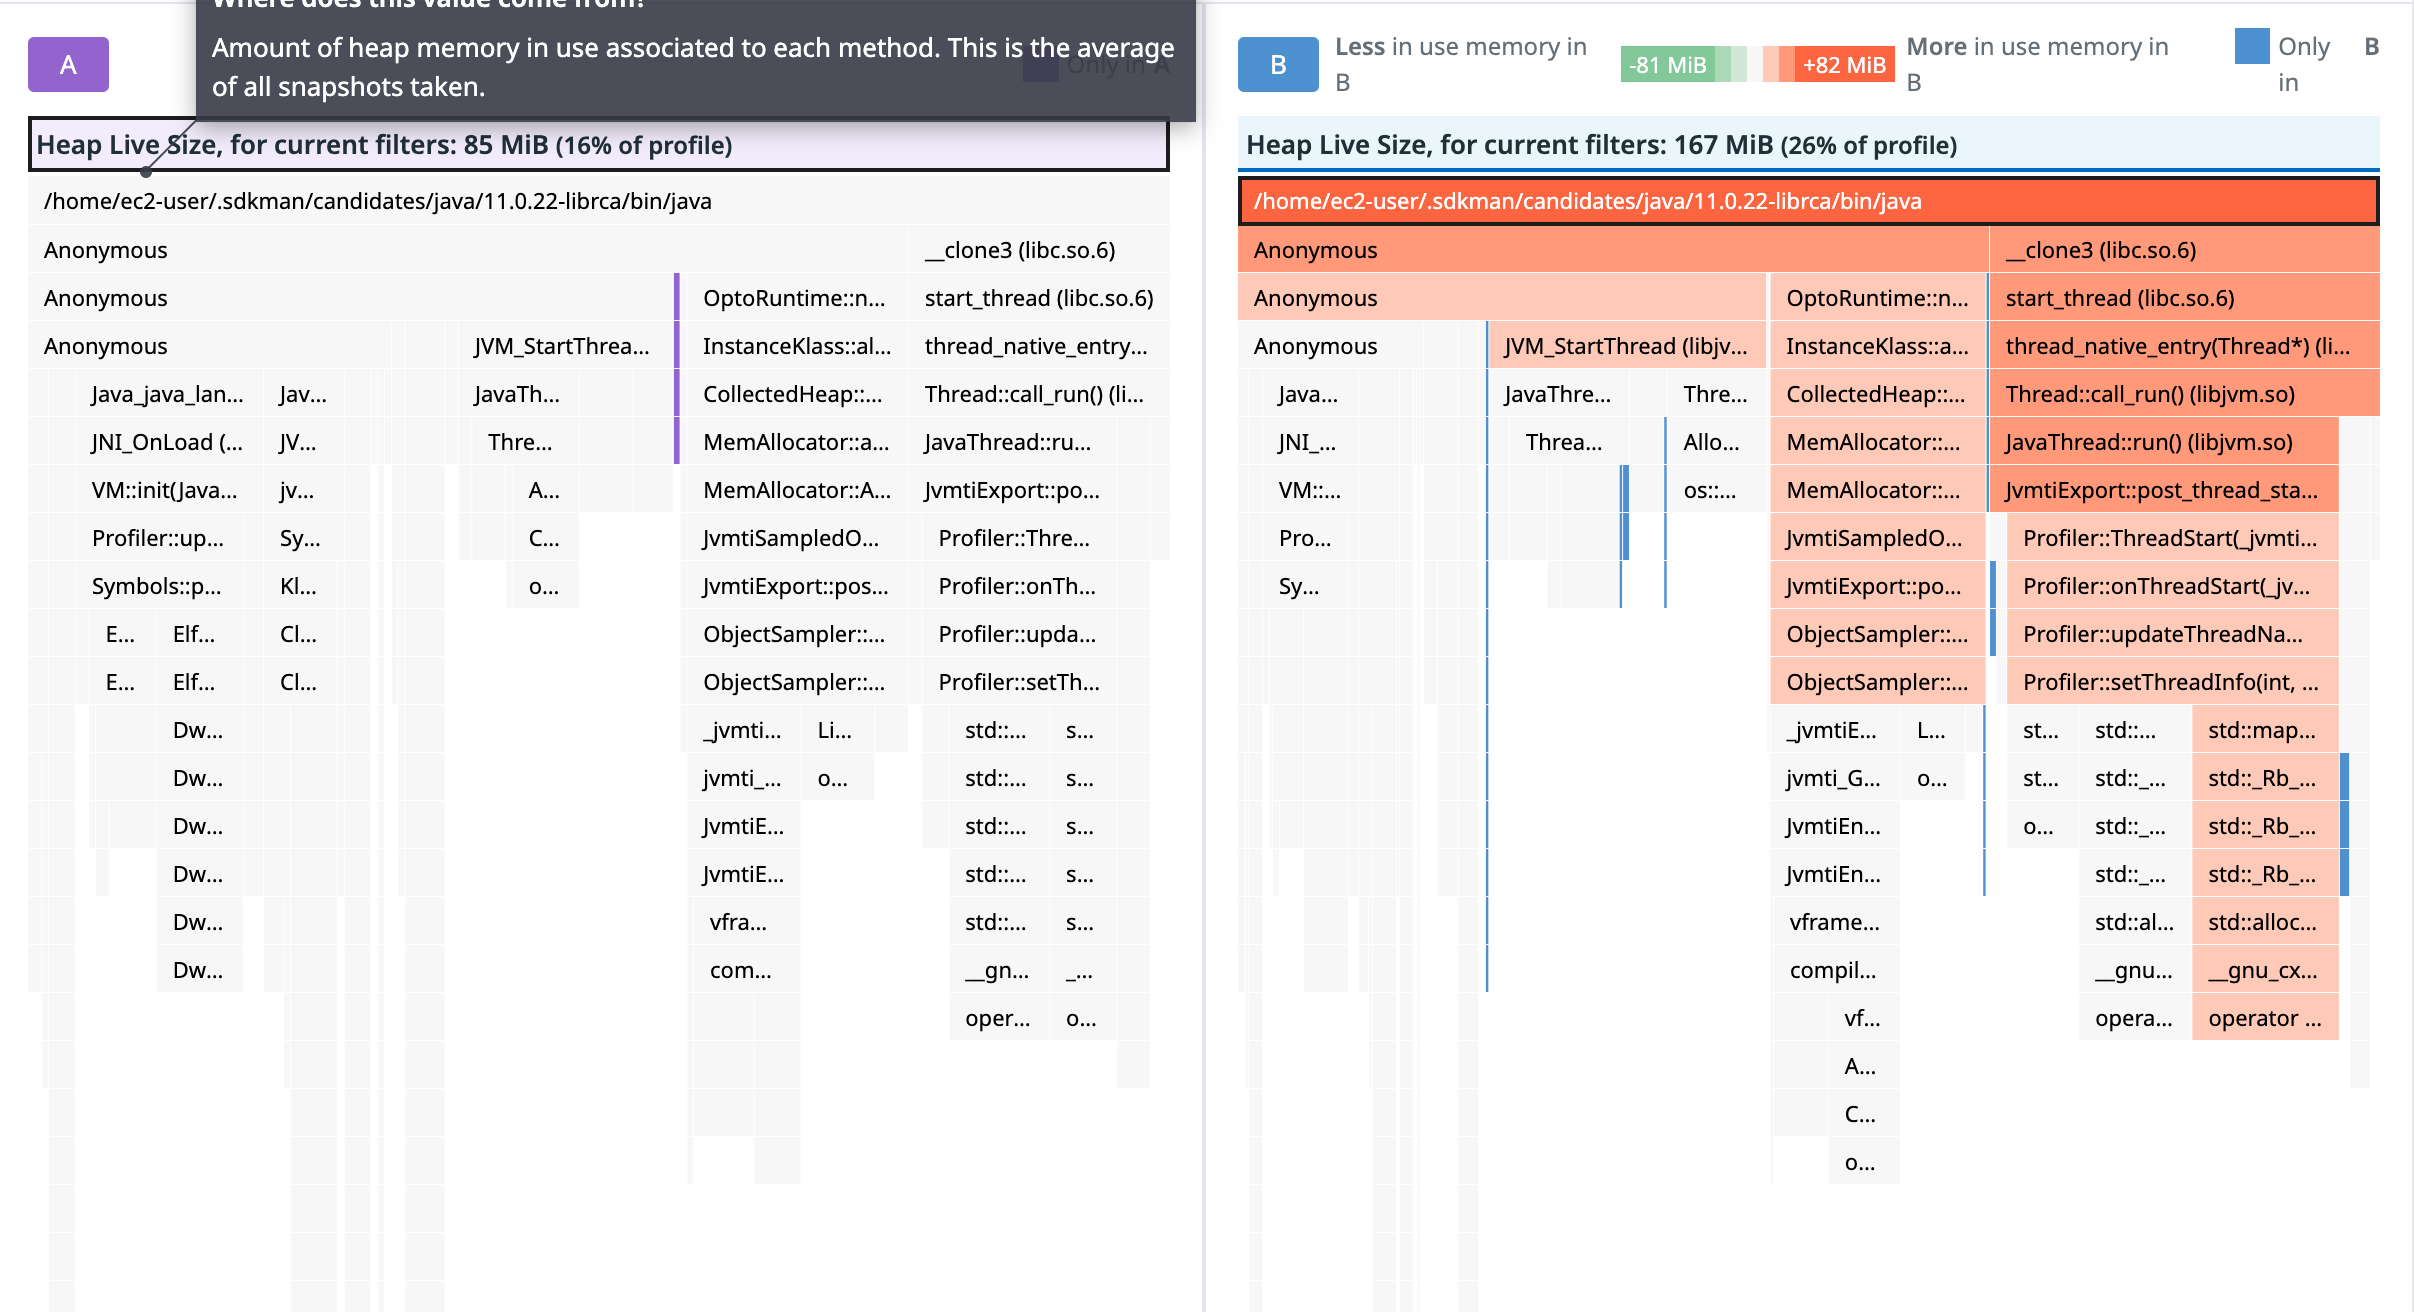
The comparison is very intuitive, at least in my opinion. The red bars represent the increase of the retained allocations from that particular allocation site. The green bars represent the decrease of the retained allocations. The blue bars are showing the allocations that were not present in the first sample but are present in the second sample.
Using this information, it becomes obvious that something is off in the part of the code responsible for updating the thread information. There are internal maps for converting the native thread ID to the Java thread ID and its name. Since threads come and go, these maps are regularly cleaned up to avoid memory leaks. And here lies the problem.
// Reset thread names and IDs
MutexLocker ml(_thread_names_lock);
if (thread_ids.empty()) {
    // take the fast path
    _thread_names.clear();
    _thread_ids.clear();
} else {
    // we need to honor the thread referenced from the liveness tracker
    std::map<int, std::string>::iterator name_itr = _thread_names.begin();
    while (name_itr != _thread_names.end()) {
        if (thread_ids.find(name_itr->first) != thread_ids.end()) {
            name_itr = _thread_names.erase(name_itr);
        } else {
            ++name_itr;
        }
    }
    std::map<int, jlong>::iterator id_itr = _thread_ids.begin();
    while (id_itr != _thread_ids.end()) {
        if (thread_ids.find(name_itr->first) != thread_ids.end()) {
            id_itr = _thread_ids.erase(id_itr);
        } else {
            ++id_itr;
        }
    }
}
Can you spot it? Yes, it’s the second loop, iterating over id_itr but checking the thread_ids for the name_itr->first.
To add insult to injury, the condition is wrong in both loops. The intention was to check if the thread_ids set, which is
the set of the thread ids being referenced from the liveness tracker, contains a particular thread id and if not, remove it.
However, the condition does the exact opposite!! No wonder the memory was leaking. The thread names and ids were almost never cleaned up, even though they were not needed anymore.
And they lived happily ever after
One would think so, but no. Once the library caused memory leak had been fixed I re-ran the reproducer. Surprisingly, the RSS was still growing, although at much slower pace. The memory leak was fixed, but there was still something else causing the memory to grow. The DDPROF live heap profiler was pointing to some internal JFR (JDK Flight Recorder) structures, but that sounding like a red herring I decided to run the reproducer with a specific configuration where only JFR was enabled, to rule out any interference from the profiler library. And the memory was still growing.
Fig2: RSS size with JFR only
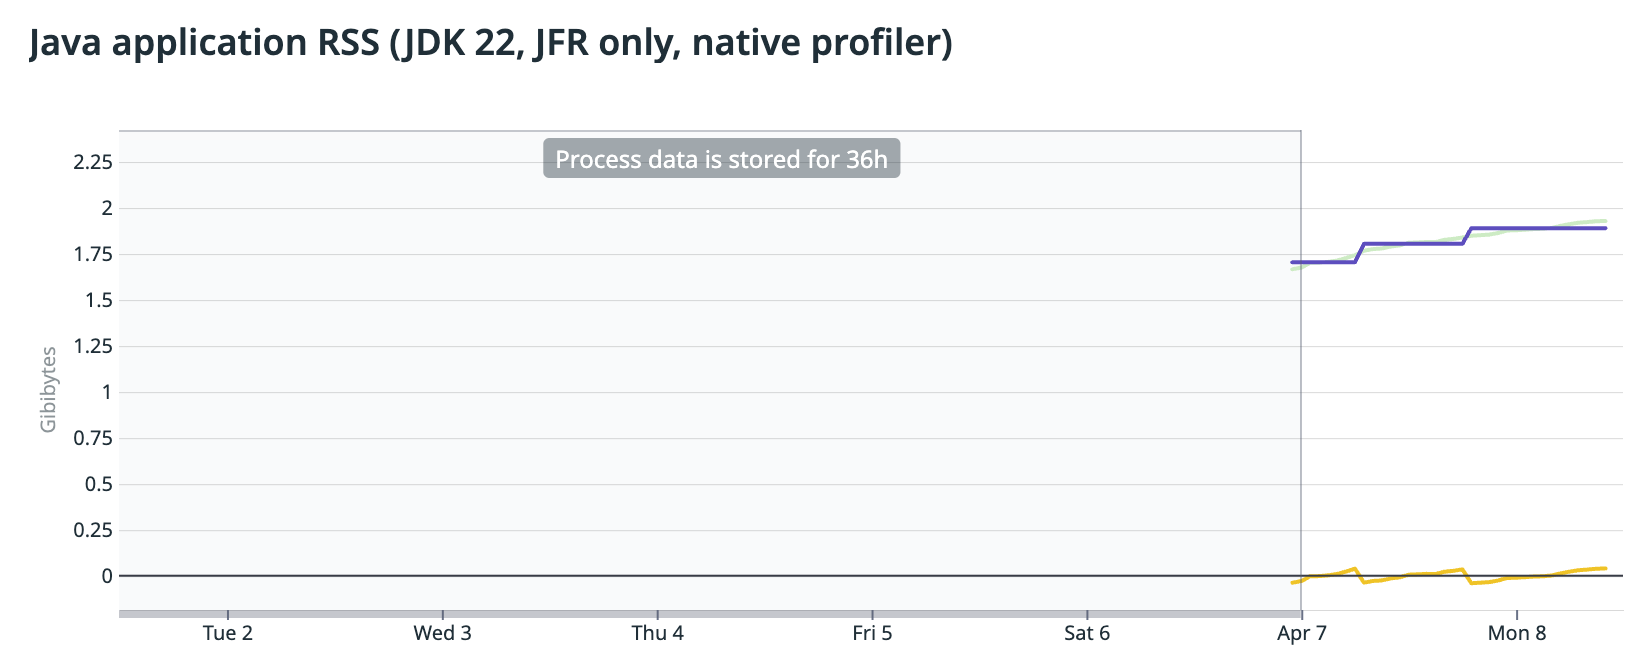
The DDPROF live heap profiler is pointing to the JfrStackTraceRepository class which seems to be growing continuously.
Fig3: Comparison of live heap profiles of JFR only reproducer
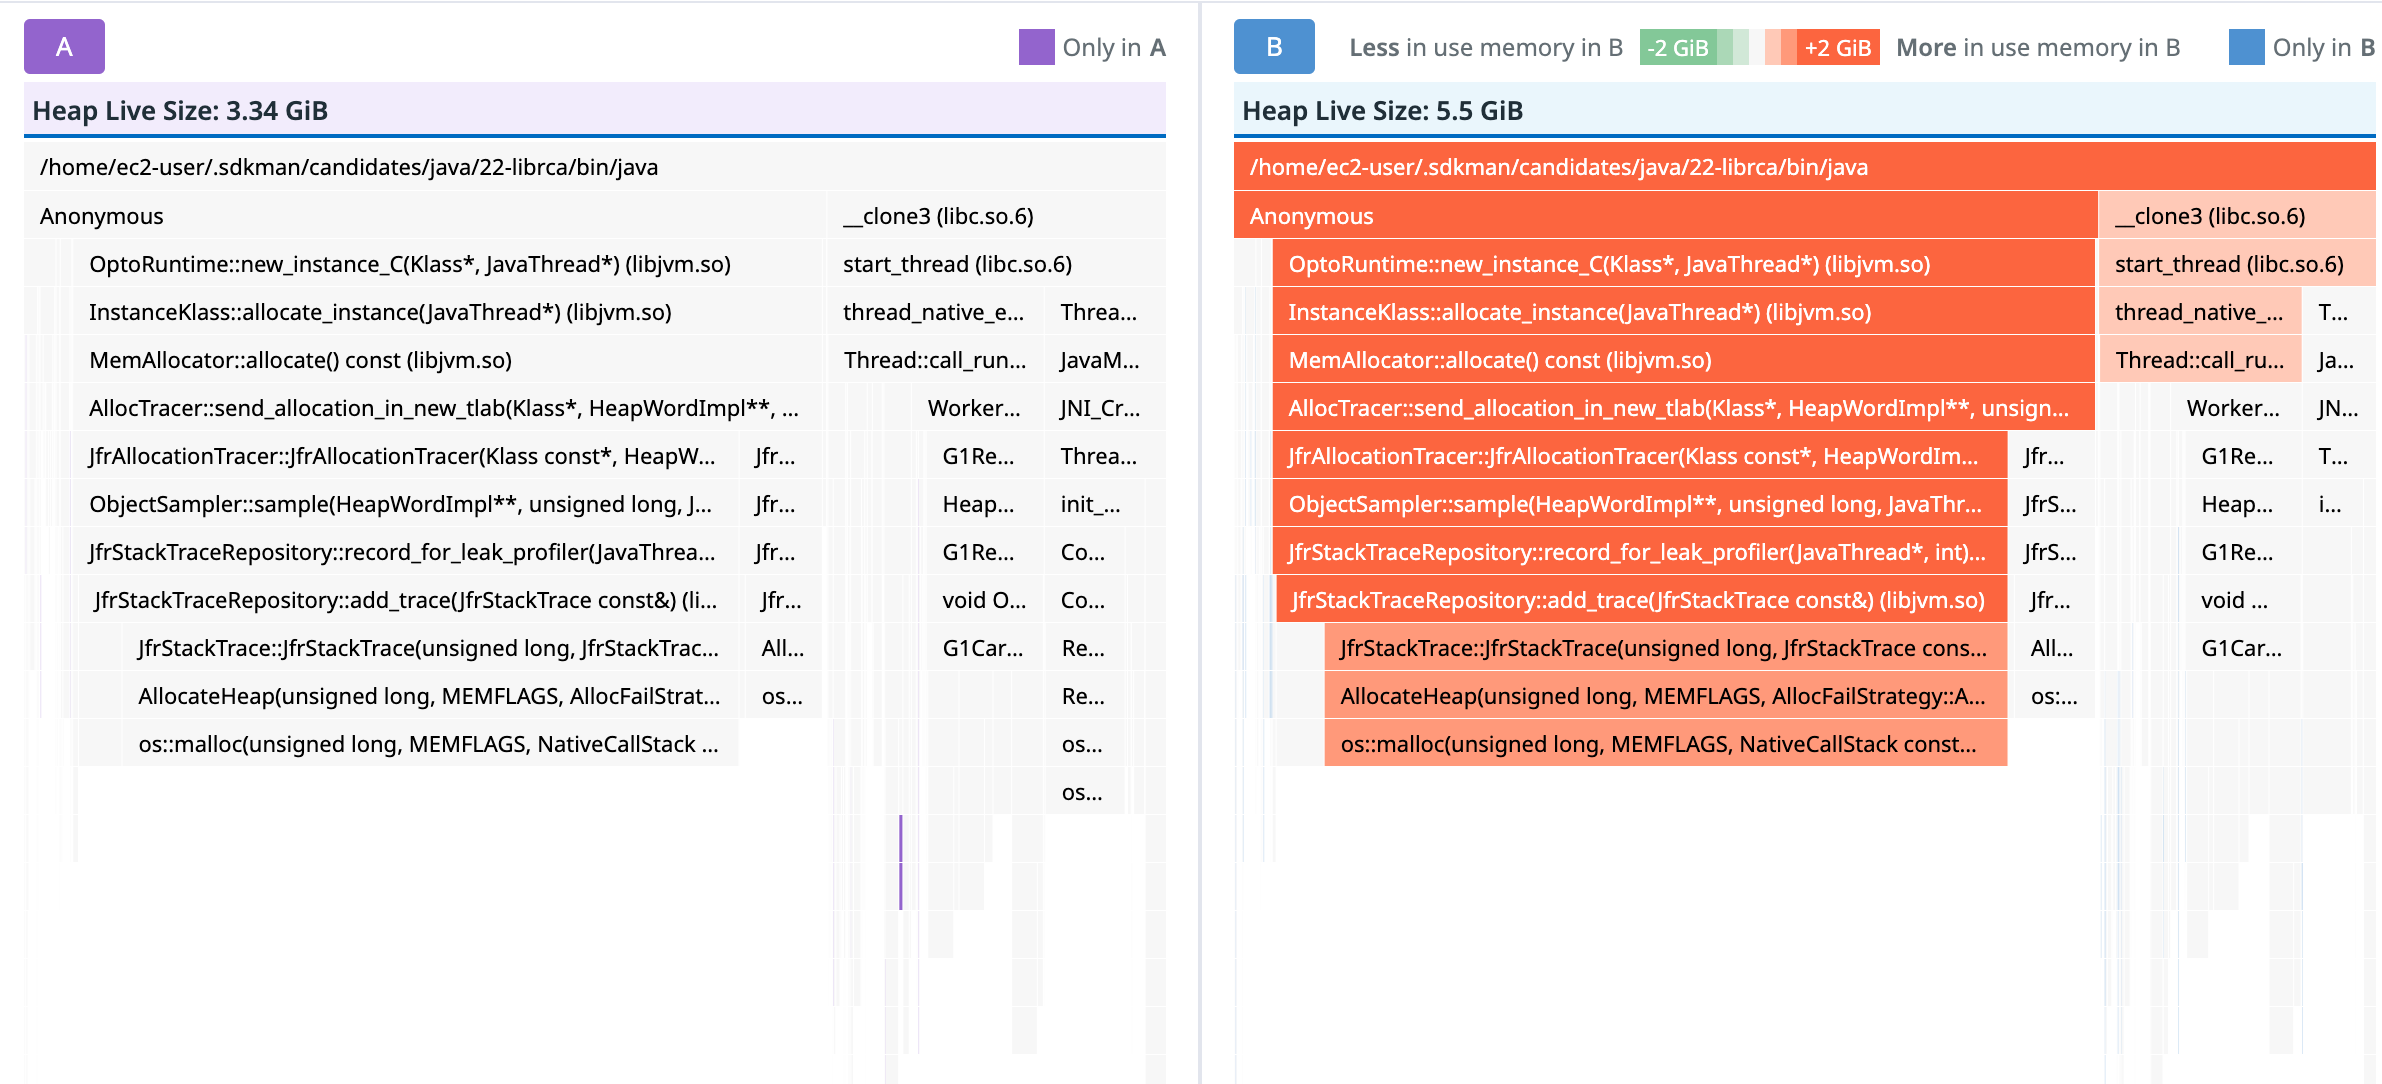
But, by all means, this should not be the case - re-checking the code that is responsible for the repository management, the repository is cleared regularly. I also peppered the code with additional, very verbose logging to see if things are as they seem and I could see that the repository was evicted regularly, all reference counts were going to zero after the eviction and there were really no dangling pieces of memory out there.
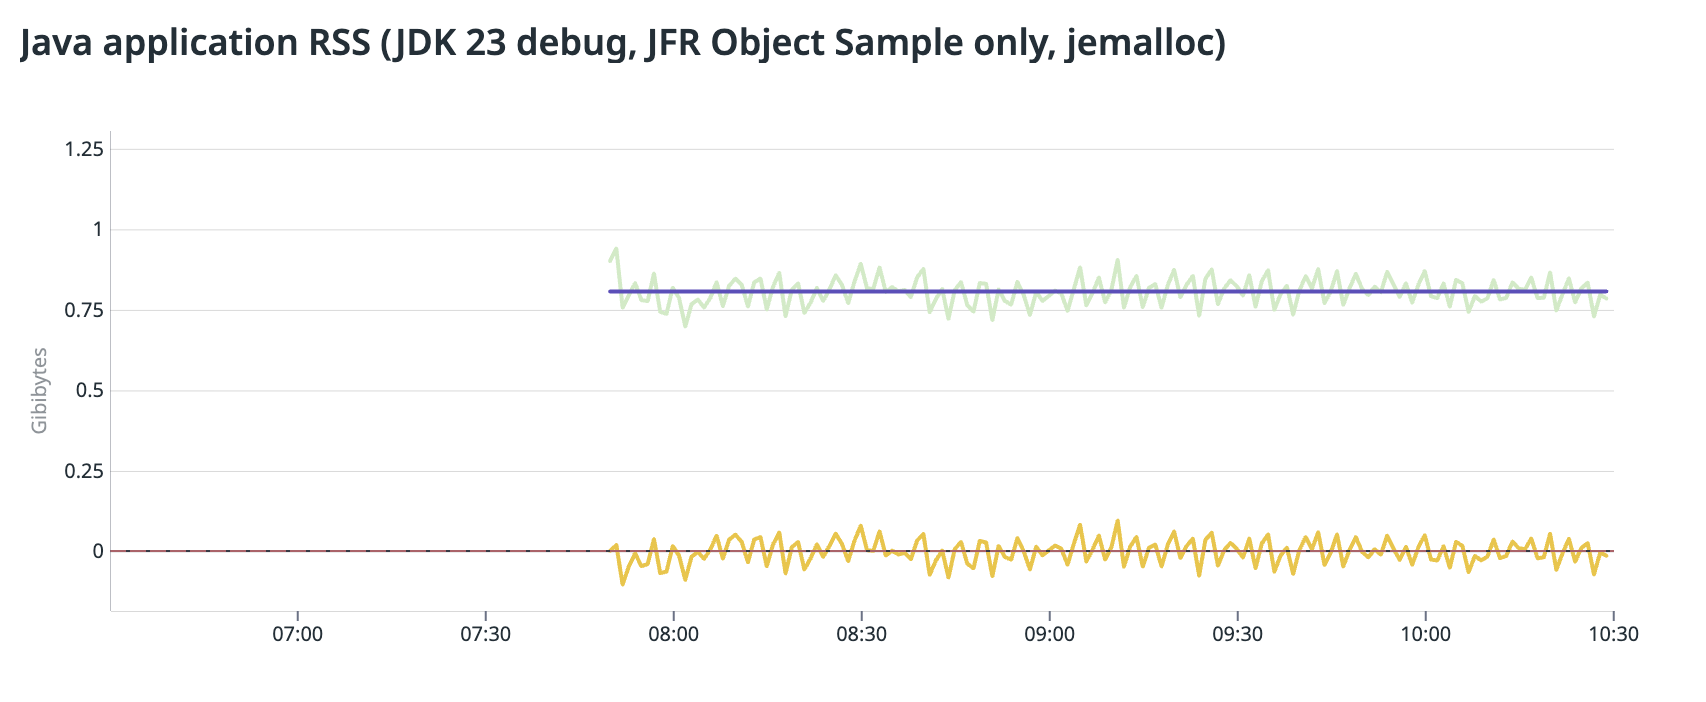
After a lot of head scratching and soul-searching, I mentioned the issue to a colleague who pointed out that they had similarly inexplicable memory leak in Ruby. And, surprisingly, the culprit was the internal fragmentation of the glibc malloc implementation.
The issue is well described by my colleague Brice Dutheil in his blog post
The remedy is to use an alternative allocator, like jemalloc or tcmalloc.
Once I siwtched to tcmalloc, the memory growth stopped and the RSS stabilized.
Fig4: RSS size with JFR and tcmalloc
Conclusion
The memory leak was fixed in no time and the fix will be deployed to our customers’ environments in the near future. It is a bit embarrassing that such a simple bug could have escaped our attention. Obviously, if the standard tools, like ASAN, were working for JVM we could have caught it immediately before ever being shipped. But if ifs and buts …
On the other hand, I was pleasantly surprised by the DDPROF live heap profiler. The setup was easy, the overhead almost undetectable, and the results were very intuitive - despite me being quite sceptical
The next steps will involve adding a specific configuration to our reliability tests to run the akka-uct benchmark with the DDPROF live heap profiler and use the results to assess the situation of possible memory leaks regularly.
The JFR memory leak was a bit more tricky. The DDPROF live heap profiler was pointing to the wrong direction, but with a bit of luck, the real culprit was discovered. Probably, the allocation patterns in JFR could be optimized to avoid the internal fragmentation, but until then one would need to use an alternative allocator to avoid the issue.
It is very interesting that the malloc fragmentation is affecting the DDPROF live heap profile. There is no other reason for the profile to be what it is but the fragmentation. Yet, the reference counting should still work there. There are certainly some interesting things to investigate and improve the live heap profiler.