Seeing In Context: A journey to contextualized JFR profiles (part 1)
Understanding Profiling Context
When working with distributed, always-on production profiling, as we do at Datadog, it’s evident that the sheer volume of data can make comprehending overall behavior challenging.
However, generic profiling data from a cloud-based fleet of processes can be broken down into more digestible segments with the aid of distributed tracing. This tracing provides a connection to the actual business logic. Here, executed code gets mapped to user-specific operations such as HTTP requests and SQL transactions. These operations can be further traced across multiple processes, hosts, and networks. Collaborating with the tracer allows direct attribution of profiling data to a specific operation, simplifying data interpretation.
But context isn’t limited to tracer data. Anything that provides user-understandable meaning to profiling data is considered a profiling context. Think of the context as tags or labels for the data. In fact, Go implements a similar concept known as profiling labels.
Contextualizing JFR data
JFR (or JDK Flight Recorder) is the primary source of profiling data for the JVM.
While it might seem that JFR lacks support for profiling context or labeling, it’s not entirely accurate. JFR has an API to create custom events where one can include any context information. However, this doesn’t apply to compiled-in events like e.g. MonitorWait or ThreadPark, which are crucial for understanding JVM behavior. Ideally, profiling context should be handled uniformly, avoiding the need for each application author to design it for their events.
Challenges and Solutions
Working around JFR’s lack of profiling context in our profiler implementation proved challenging. Many ideas seemed promising until they were tested against real-world workloads.
Scope Events
Our initial approach was “scope events”. Simply put, since we had a tracer implementation that maintained scopes (a scope exists while a span runs on a thread), this seemed to fit the profiling context neatly. Early prototypes looked promising for standard applications. However, for async and reactive applications, the required scope volume skyrocketed, causing a JFR recording bloat (more than a 10x size increase) and increased processing costs. Sampling these scope events would create disjointed data sets, and their hierarchical nature would complicate the sampling process even further.
Checkpoints
Our next strategy involved recording “state transitions” like “started work A”, “paused work A”, etc. This seemed like a good way to reconstruct system behavior. While this approach fared well in general, async and reactive applications again posed challenges. The vast number of checkpoints from tracking work in these applications made it unfeasible.
Profiling context proper
On our third attempt, we turned to async-profiler. This excellent open-source tool was easily extensible to support our profiling context.
Requirements
The requirements were simple:
- Context is per-thread
- Storing context must be cheap in terms of memory
- Context memory storage must be bounded
- Setting and getting context must be cheap in terms of execution overhead
Implementation
Here you can find a brief overview of the implementation. For more details and interesting use cases you can check out Richard Startin’s blog.
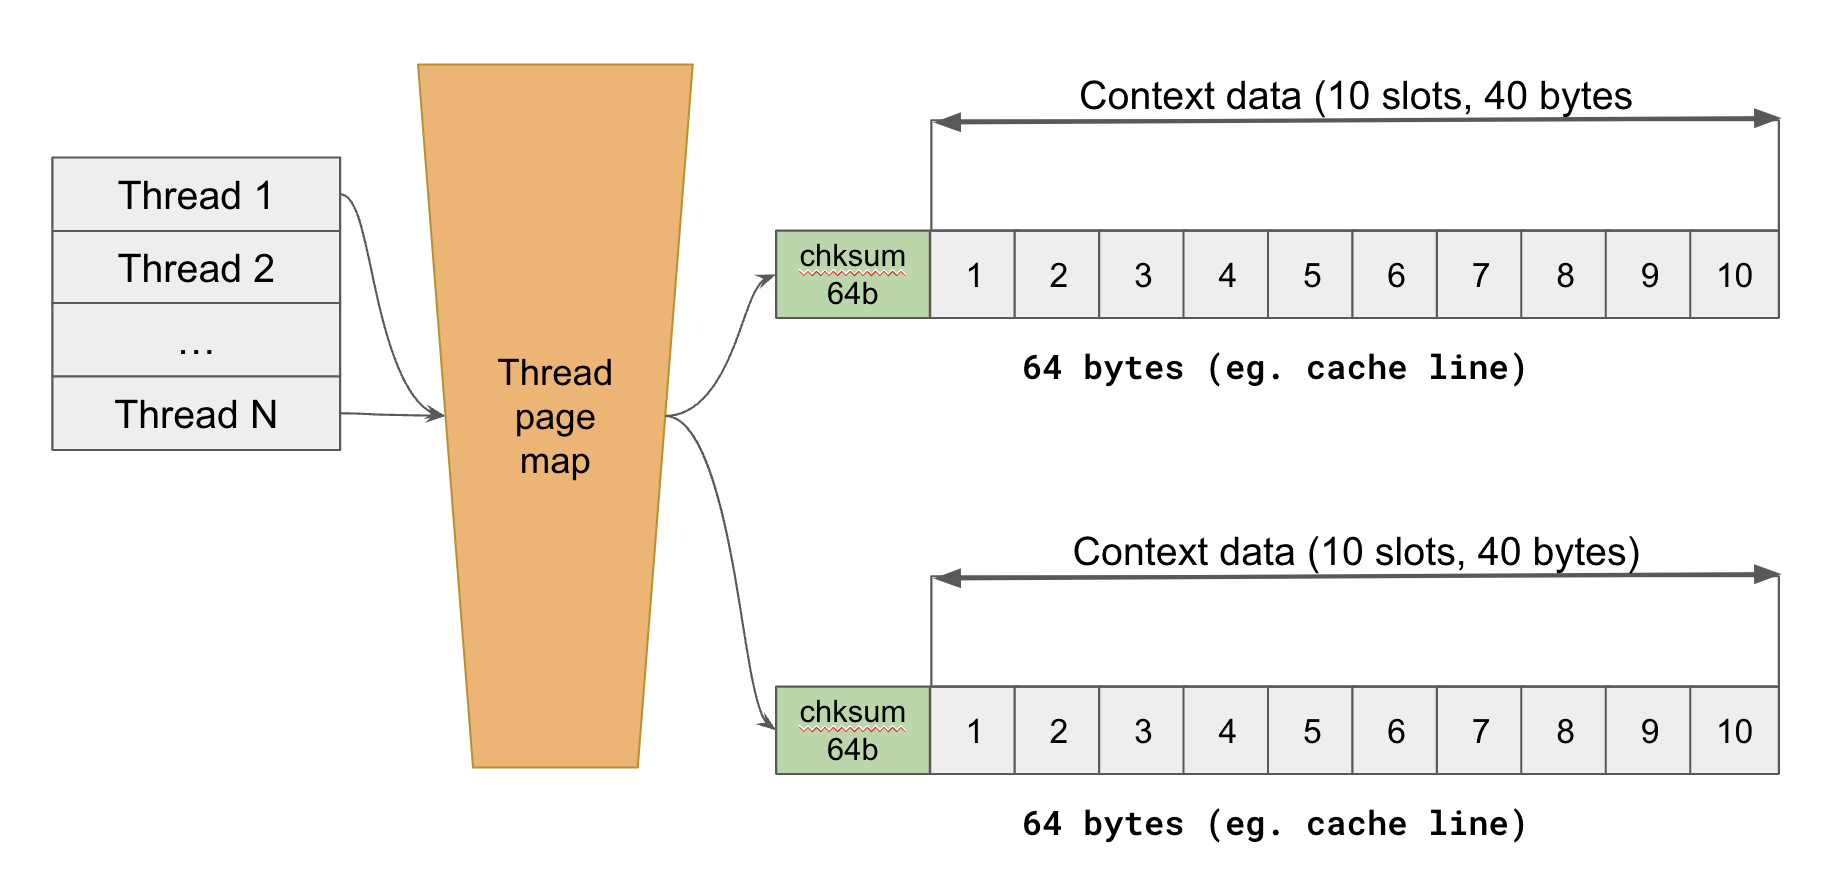
- Base Structure: The core of the implementation is a sparse map. Each entry in this map is keyed by a thread ID and linked to a 64-byte context block.
- Context Block Design: At the outset of each profiling session, the slots within these context blocks are assigned specific meanings, such as
traceid,spanid, orrest_endpoint. Once set, each slot in the block points to a dictionarized string. - Java-Native Interoperability: As the profiler library is native, it’s crucial to maintain fast interoperability between Java and the native environment while minimizing JNI costs. To achieve this, we’ve mapped context blocks to direct byte buffers. This configuration allows seamless writing from Java and reading from the native side.
Java API
This is the low level raw Java API to interact with the profiling context in the Datadog profiler library.
// first, set up the context setter and retrieve the attribute offsets
var ctxSetter = new ContextSetter(javaProfiler, List.of("traceid", "spanid"));
// resolving the attribute offsets is not mandatory but is useful when attribute is accessed frequently
var traceidOffset = ctxSetter.offsetOf("traceid");
var spanidOffset = ctxSetter.offsetOf("spanid");
// do some stuff
ctxSetter.setAttribute(traceidOffset, "trace1");
ctxSetter.setAttribute(spanidOffset, "span1");
// now perform some work which will cause various JFR events being emitted
// those events will be recorded with the extra context [traceid=trace1, spanid=span1]

// and now clear the context
// forgetting to clear the context will cause incorrect context being reported but will not cause a catastrophic memory leak
ctxSetter.clearAttribute(traceidOffset);
ctxSetter.clearAttribute(spanidOffset);
As one can see the low level Java API is relying on the context not being set and read concurrently. This is in general true as the code itself, be it the original one or injected by the tracer instrumentation, will first set up the context then do some work and then clean up the context. Therefore, it is safe to perform the setup and clean non-atomically.
The Outcome
We’re quite pleased with our profiling context’s current implementation. Its user-defined nature (versus pre-set attributes) means it’s versatile. It can be utilized in innovative ways, addressing the real user problems, such as Understanding Request Latency.
However, having the context maintained externally, in a profiler library as opposed to it being an integral part of JFR remains a limiting factor. We still can’t contextualize the really interesting compiled-in JFR events, and we must maintain our own profiling library based on not-exactly-supported AsyncGetCallTrace API - there is JEP 435 meaning to introduce a better alternative to AsyncGetCallTrace, but it is not sure if and when it will happen.
With all this said it is very obvious that having first class support of the profiling context directly in JFR would be more than welcome. And I am going to talk about my proposal for getting the Profiling Context API to JFR in my next blog post.