Mysterious jmethodID
What is jmethodID and why do I care
Let me start with a short introduction to the concept of jmethodID.
When working in the realm of JNI (Java Native Interface), we can obtain references to Java methods which can later be used to, for example, invoke the method. The reference to the method is represented by a jmethodID type, which is an opaque pointer to a structure containing the method’s metadata.
Why do we need an opaque pointer instead of just using the method reference in the form of jmethod directly? The answer is simple - the method reference is not stable. With the ability to retransform classes, the method reference can change at any time, invalidating any previously obtained references. Therefore, JNI uses the jmethodID type to represent the method reference, which is stable and can be used to invoke the method even after retransformations. The runtime will ensure the jmethodID is updated to point to the correct method metadata after retransformation.
However, there is one caveat: the jmethodID is only valid as long as there is a strong reference to the class containing the method that the jmethodID is pointing to. Once the class is unloaded, the jmethodID becomes invalid, and when it is used to resolve to a jmethod instance, it will return NULL. Although this is Hotspot-specific behavior, it is not something required by the JNI specification. As such, crashes may occur in other JVM (Java Virtual Machine) implementations when using invalid jmethodID values.
Later in this article, I will focus on the Hotspot implementation of jmethodID and how invalid jmethodID values can still pose problems.
jmethodID and profilers
Unsurprisingly, the stack traces obtained via the GetStackTrace or GetAllStackTraces JNI functions have their stack frames represented by jmethodID values. However, for all threads except the current one, it is impossible to guarantee that the classes referenced in the stack trace via jmethodID will be strongly held, making the behavior more or less undefined.
In Hotspot, the implementation is hardened and is supposed to handle invalid jmethodID values gracefully, compensating for this hole in the specification.
However, there is a bug - JDK-8313816 - causing spurious JVM crashes when trying to resolve the jmethodID values captured as a stack trace sometime later after obtaining the stack trace. The bug is not easy to reproduce, and it took a significant amount of time to find a reliable reproducer. The reproducer is not perfect, but it is good enough to trigger the crashes reliably. Unfortunately, it is a test suite of an internal project that heavily uses Mockito and will trigger the crashes within a few tens of seconds.
The sad reality is that this crash makes any profiler implementation using the JVMTI functions to obtain stack traces unusable in an always-on, in-production manner.
Investigation
I must admit, this particular crash has preoccupied me for many months. Not completely understanding the underlying
implementation, I took several wrong turns and even proposed a patch, which turned out to solve nothing. But all that time,
I was convinced there was a subtle bug in the Hotspot implementation of jmethodid, while many people remained
skeptical, attributing the crash to incorrect usage of jmethodid values.
What is that assert doing
The vast majority of the crashes were happening in Method::checked_resolve_jmethod_id() call. While examining the code
I skimmed over this statement
assert(is_valid_method(o), "should be valid jmethodid");just assuming that under normal circumstances this assert should never trigger. Well, that is until I ran the reproducer
with fastdebug OpenJDK build which enabled all those asserts. And suddenly, I saw the root cause for all those various
crashes - the captured jmethodid values are becoming invalid and when they are used there is a good chance of crashing JVM.
So, I set out on checking the source code of the Method::is_valid_method() function.
// Check that this pointer is valid by checking that the vtbl pointer matches
bool Method::is_valid_method(const Method* m) {
  if (m == nullptr) {
    return false;
  } else if ((intptr_t(m) & (wordSize-1)) != 0) {
    // Quick sanity check on pointer.
    return false;
  } else if (!os::is_readable_range(m, m + 1)) {
    return false;
  } else if (m->is_shared()) {
    return CppVtables::is_valid_shared_method(m);
  } else if (Metaspace::contains_non_shared(m)) {
    return has_method_vptr((const void*)m);
  } else {
    return false;
  }
}
Well, that’s a few cases where jmethodid can be invalid! But which ones are triggering when I am getting the follow-up crash? In order to do that, I resorted to ‘printf debugging’, inserting printf statements into each branch with a ‘unique’ id, so it would be easy to match the failed precondition with the code path leading to the crash.
Long story short - when has_method_vptr((const void*)m) returns false and such an invalid jmethodid is then used, it is almost certain that usage will crash the JVM. Well, we are trying to use a memory blob as an object instance, but it is missing the valid object header. It only makes sense that this attempt can lead to very bad things.
Hygiene is important
At this point, I formed a hypothesis that the affected jmethodID is pointing to a Method object which was reclaimed, and part or all of the memory originally occupied by that instance was overwritten.
The 100-point question is: when can a Method object be reclaimed? Well, it turns out the JVM is very strict about that. A Method can be reclaimed only when its containing class is unloaded. And when is a class allowed to be unloaded? Only when its associated classloader is not referenced anymore. A bit of code searching and following call sites led me to ClassLoaderData::unload(). And indeed, the jmethodIDs associated with the methods from that class loader are wiped in order to make sure they will not be pointing to deallocated objects.
  // Method::clear_jmethod_ids only sets the jmethod_ids to null without
  // releasing the memory for related JNIMethodBlocks and JNIMethodBlockNodes.
  // This is done intentionally because native code (e.g. JVMTI agent) holding
  // jmethod_ids may access them after the associated classes and class loader
  // are unloaded. The Java Native Interface Specification says "method ID
  // does not prevent the VM from unloading the class from which the ID has
  // been derived. After the class is unloaded, the method or field ID becomes
  // invalid". In real world usages, the native code may rely on jmethod_ids
  // being null after class unloading. Hence, it is unsafe to free the memory
  // from the VM side without knowing when native code is going to stop using
  // them.
  if (_jmethod_ids != nullptr) {
    Method::clear_jmethod_ids(this);
  }
So, this should work, right? Hotspot takes care of nulling the references to ensure no invalid memory can be accessed via dangling pointers, and unloading is conducted in a VM operation, guaranteeing that the native code and the unloading process never race. All parts are in place, and yet, it is still possible to trigger a JVM crash quite reliably. There must be something else at play.
Asserts and guarantees
You are probably familiar with the concept of code asserts - they should capture invariants and fail if these are broken. Since the invariants are supposed to hold at all times, usually the asserts are enabled only in ‘debug’ builds. This makes them extremely cheap in non-debug builds, because they are physically removed from the resulting machine code.
In the JVM codebase, in addition to assert, there is also guarantee. Guarantee works pretty much like an assert, with the difference that guarantee will trigger also in a non-debug build.
‘What are you getting at?’, you might ask now. The answer is simple - I needed a way to ‘annotate’ the JVM code dealing with jmethodIDs, and particularly, deallocating the Method instances with various invariant checks. But, since my reproducer is quite a large application, running it with a debug build became quite problematic because it became really, really slow. So, I used temporary guarantees instead.
In the InstanceKlass class, which represents Java class metadata (very simply put), there is an interestingly looking function deallocate_contents().
// This function deallocates the metadata and C heap pointers that the
// InstanceKlass points to.
void InstanceKlass::deallocate_contents(ClassLoaderData* loader_data)
This function, in turn, calls InstanceKlass::deallocate_methods(), which takes care of physically deallocating all
the Method instances contained in the current InstanceKlass. That looks promising - the assumption is that once
a Method instance is deallocated, the jmethodid pointing to that method should be updated to nullptr instead.
This should be quite easy to express as an invariant via guarantee -
void InstanceKlass::deallocate_methods(ClassLoaderData* loader_data,
                                       Array<Method*>* methods) {
  if (methods != nullptr && methods != Universe::the_empty_method_array() &&
      !methods->is_shared()) {
    for (int i = 0; i < methods->length(); i++) {
      Method* method = methods->at(i);
      if (method == nullptr) continue;  // maybe null if error processing
      // Only want to delete methods that are not executing for RedefineClasses.
      // The previous version will point to them so they're not totally dangling
      assert (!method->on_stack(), "shouldn't be called with methods on stack");

      // >>> inserted code
      // try and resolve the jmethodid from the `Method` instance
      jmethodID jmid = method->find_jmethod_id_or_null();
      // <<<

      MetadataFactory::free_metadata(loader_data, method);

      // >>> inserted code
      // The method that was deallocated must not have a jmethodid pointing to it
      // Because class redefinitions/retransformations can introduce new method versions
      // a jmethodid pointing to the original version will be updated to point to newer version
      // making it necessary to also assert that the jmethodid is actually pointing to the method
      // being deallocated
      guarantee(jmid == nullptr || *((Method**)jmid) == nullptr || *((Method**)jmid) != method, "jmethodid was not cleaned up: %p", (void*)jmid);
      // <<<
    }
    MetadataFactory::free_array<Method*>(loader_data, methods);
  }
}
Rebuilding the OpenJDK with the added guarantee and rerunning the reproducer quickly demonstrates that there is indeed an invariant violation. As expected, the guarantee fails, resulting in the following stack trace:
Stack: [0x000000016f708000,0x000000016f90b000],  sp=0x000000016f90a7b0,  free space=2057k
Native frames: (J=compiled Java code, j=interpreted, Vv=VM code, C=native code)
V  [libjvm.dylib+0xa5def0]  VMError::report_and_die(int, char const*, char const*, char*, Thread*, unsigned char*, void*, void*, char const*, int, unsigned long)+0x52c  (instanceKlass.cpp:551)
V  [libjvm.dylib+0xa5e64c]  VMError::report_and_die(Thread*, char const*, int, unsigned long, VMErrorType, char const*, char*)+0x0
V  [libjvm.dylib+0x2d9bb4]  print_error_for_unit_test(char const*, char const*, char*)+0x0
V  [libjvm.dylib+0x47da14]  InstanceKlass::deallocate_methods(ClassLoaderData*, Array<Method*>*)+0x14c
V  [libjvm.dylib+0x47dcfc]  InstanceKlass::deallocate_contents(ClassLoaderData*)+0x94
V  [libjvm.dylib+0x487b70]  InstanceKlass::purge_previous_version_list()+0xc4
V  [libjvm.dylib+0x25b08c]  ClassLoaderData::classes_do(void (*)(InstanceKlass*))+0x3c
V  [libjvm.dylib+0x25ed24]  ClassLoaderDataGraph::clean_deallocate_lists(bool)+0x7c
V  [libjvm.dylib+0x25ee08]  ClassLoaderDataGraph::walk_metadata_and_clean_metaspaces()+0x38
V  [libjvm.dylib+0xa64ad4]  VM_Operation::evaluate()+0xe4
V  [libjvm.dylib+0xa71458]  VMThread::evaluate_operation(VM_Operation*)+0xe4
V  [libjvm.dylib+0xa71c90]  VMThread::inner_execute(VM_Operation*)+0x28c
V  [libjvm.dylib+0xa7112c]  VMThread::run()+0xcc
V  [libjvm.dylib+0x9e7b5c]  Thread::call_run()+0xc8
V  [libjvm.dylib+0x8180e0]  thread_native_entry(Thread*)+0x118
C  [libsystem_pthread.dylib+0x6fa8]  _pthread_start+0x94
VM_Operation (0x0000000170252d60): CleanClassLoaderDataMetaspaces, mode: safepoint, requested by thread 0x000000011480a400
Down the rabbit hole
Hm, apparently, there is another code path that deallocates InstanceKlass contents (and transitively the contained
methods) in addition to ClassLoaderData::unload(). It starts in ClassLoaderDataGraph and the method of interest is
void ClassLoaderDataGraph::clean_deallocate_lists(bool walk_previous_versions) {
  assert(SafepointSynchronize::is_at_safepoint(), "must only be called at safepoint");
  uint loaders_processed = 0;
  for (ClassLoaderData* cld = _head; cld != nullptr; cld = cld->next()) {
    // is_alive check will be necessary for concurrent class unloading.
>>> if (cld->is_alive()) { <<<<
      // clean metaspace
      if (walk_previous_versions) {
        cld->classes_do(InstanceKlass::purge_previous_versions);
      }
      cld->free_deallocate_list();
      loaders_processed++;
    }
  }
  log_debug(class, loader, data)("clean_deallocate_lists: loaders processed %u %s",
                                 loaders_processed, walk_previous_versions ? "walk_previous_versions" : "");
}
Yes! The methods are being deallocated for a class loader that is still alive. Therefore, the code taking care of
all jmmethodids associated with this class loader is not called, and any deallocated method has the potential to leave
a dangling pointer in the corresponding jmethodid value.
Let’s fix it!
Good, it seems like the fix is trivial. Let’s just do this
void InstanceKlass::deallocate_methods(ClassLoaderData* loader_data,
                                       Array<Method*>* methods) {
  if (methods != nullptr && methods != Universe::the_empty_method_array() &&
      !methods->is_shared()) {
    for (int i = 0; i < methods->length(); i++) {
      Method* method = methods->at(i);
      if (method == nullptr) continue;  // maybe null if error processing
      // Only want to delete methods that are not executing for RedefineClasses.
      // The previous version will point to them so they're not totally dangling
      assert (!method->on_stack(), "shouldn't be called with methods on stack");

      jmethodID jmid = method->find_jmethod_id_or_null();
      // Do the pointer maintenance before releasing the metadata, just in case
      // We need to make sure that jmethodID actually resolves to this method
      // - multiple redefined versions may share jmethodID slots and if a method
      //   has already been rewired to a newer version we could be removing reference
      //   to a still existing method instance
      if (jmid != nullptr && *((Method**)jmid) == method) {
        // dangling pointer; needs to be cleaned up
        *((Method**)jmid) = nullptr;
      }
      MetadataFactory::free_metadata(loader_data, method);
    }
    MetadataFactory::free_array<Method*>(loader_data, methods);
  }
}
And we are done. Honestly, I can’t believe the fix was so easy. I just had to update the jmethodID value to not point
to Method instances that are known to be deallocated shortly.
What is the real cause?
As you probably expect, I left out a lot of wrong turns I took while investigating. Although not leading to the fix, they helped me understand the underlying cause, which is the class redefinition/retransformation. Do you remember InstanceKlass::purge_previous_versions from the failed guarantee stack trace? The ‘previous versions’ are older forms of redefined classes when some of the methods of those classes were running at the time they were redefined, and because of that, the JVM had to keep them around for a while. Then, from time to time, the JVM will check if it is possible to unload those class versions.
The tricky part is that the JVM will keep the jmethodID cache only in the ‘main’ class version, dynamically extending the cache to accommodate jmethodID values from obsolete but yet still active class versions. This can happen, e.g., when a class is redefined, the previous version is marked obsolete, but there are still some of its methods somewhere on the stack, and at that moment, we call GetStackTrace. New jmethodID values will be generated as required, and they will be placed in the jmethodID cache in the main version.
And here come the giggles - after an older class version has been purged, the jmethodID values are still present in the main class version cache but pointing to deallocated Method instances!
Ok, now the loop is closed, and I am pretty sure the proposed fix is correct and actually addresses the root cause.
There is still more to it
The way jmethodID values are stored for previous versions of a retransformed class also opens a whole new can of worms - requesting a jmethodID for an older method version may lead to cache resizing, which in turn will cause memory allocation. And remember, doing memory allocations in signal handlers is bad, mmkay? How is CPU and wallclock profiling generally done? Well, glad you asked - it’s by sending a signal to the JVM and letting the signal handler call AsyncGetCallTrace, which returns a stack trace comprised of, drumroll please, jmethodID values.
Sensible JVM profiler implementations try to avoid jmethodID cache resizes by eagerly requesting all the jmethodID values for all methods in the class upon class load. However, this strategy won’t work if the cache is resized because a previous method version jmethodID is requested.
Honestly, I don’t have a good solution for this yet. It might take some time to figure out how to address this issue.
Diagram time
For posterity, I am adding the schematic diagrams about how the jmethodID cache is organized for a redefined class.
Fig1: Overview of the jmethodID storage
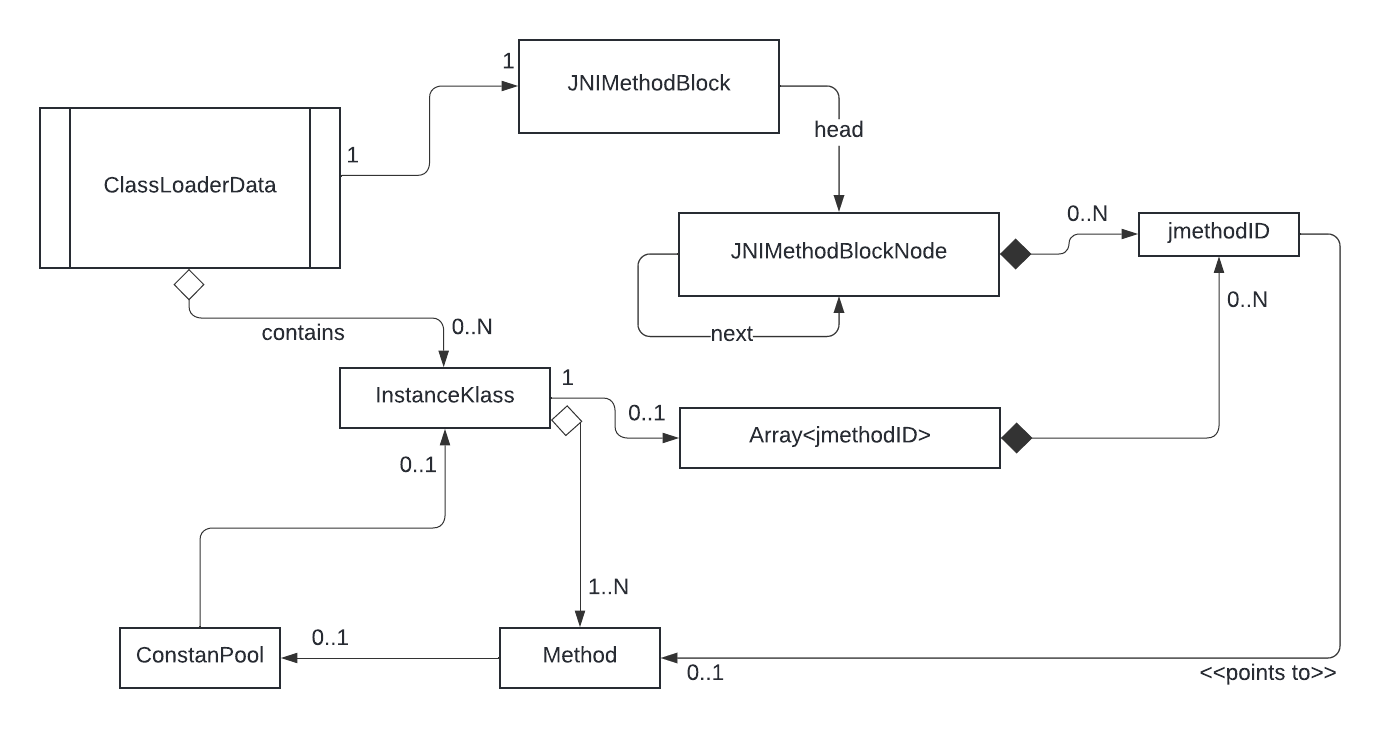
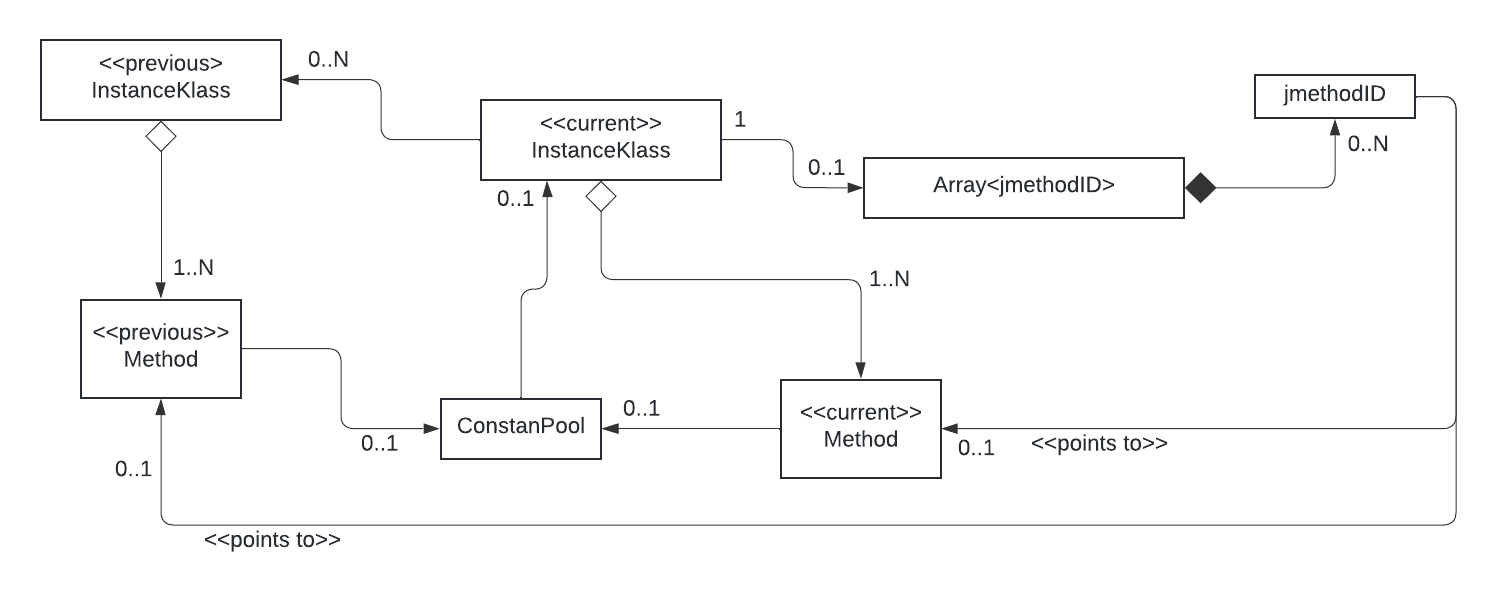
Fig2: How the jmethodIDs are stored for a redefined class
Next steps
The next steps would be trying to create a JTREG test for the fix. I will have to look around for tests that involve class redefinitions with several versions of a redefined class. Additionally, I need to find other tests that trigger metaspace cleanup. This way, I can combine them to trigger the problematic behavior. However, if this turns out to be too complicated, I would rather propose the fix and aim to get it into the upcoming JDK updates as soon as possible.