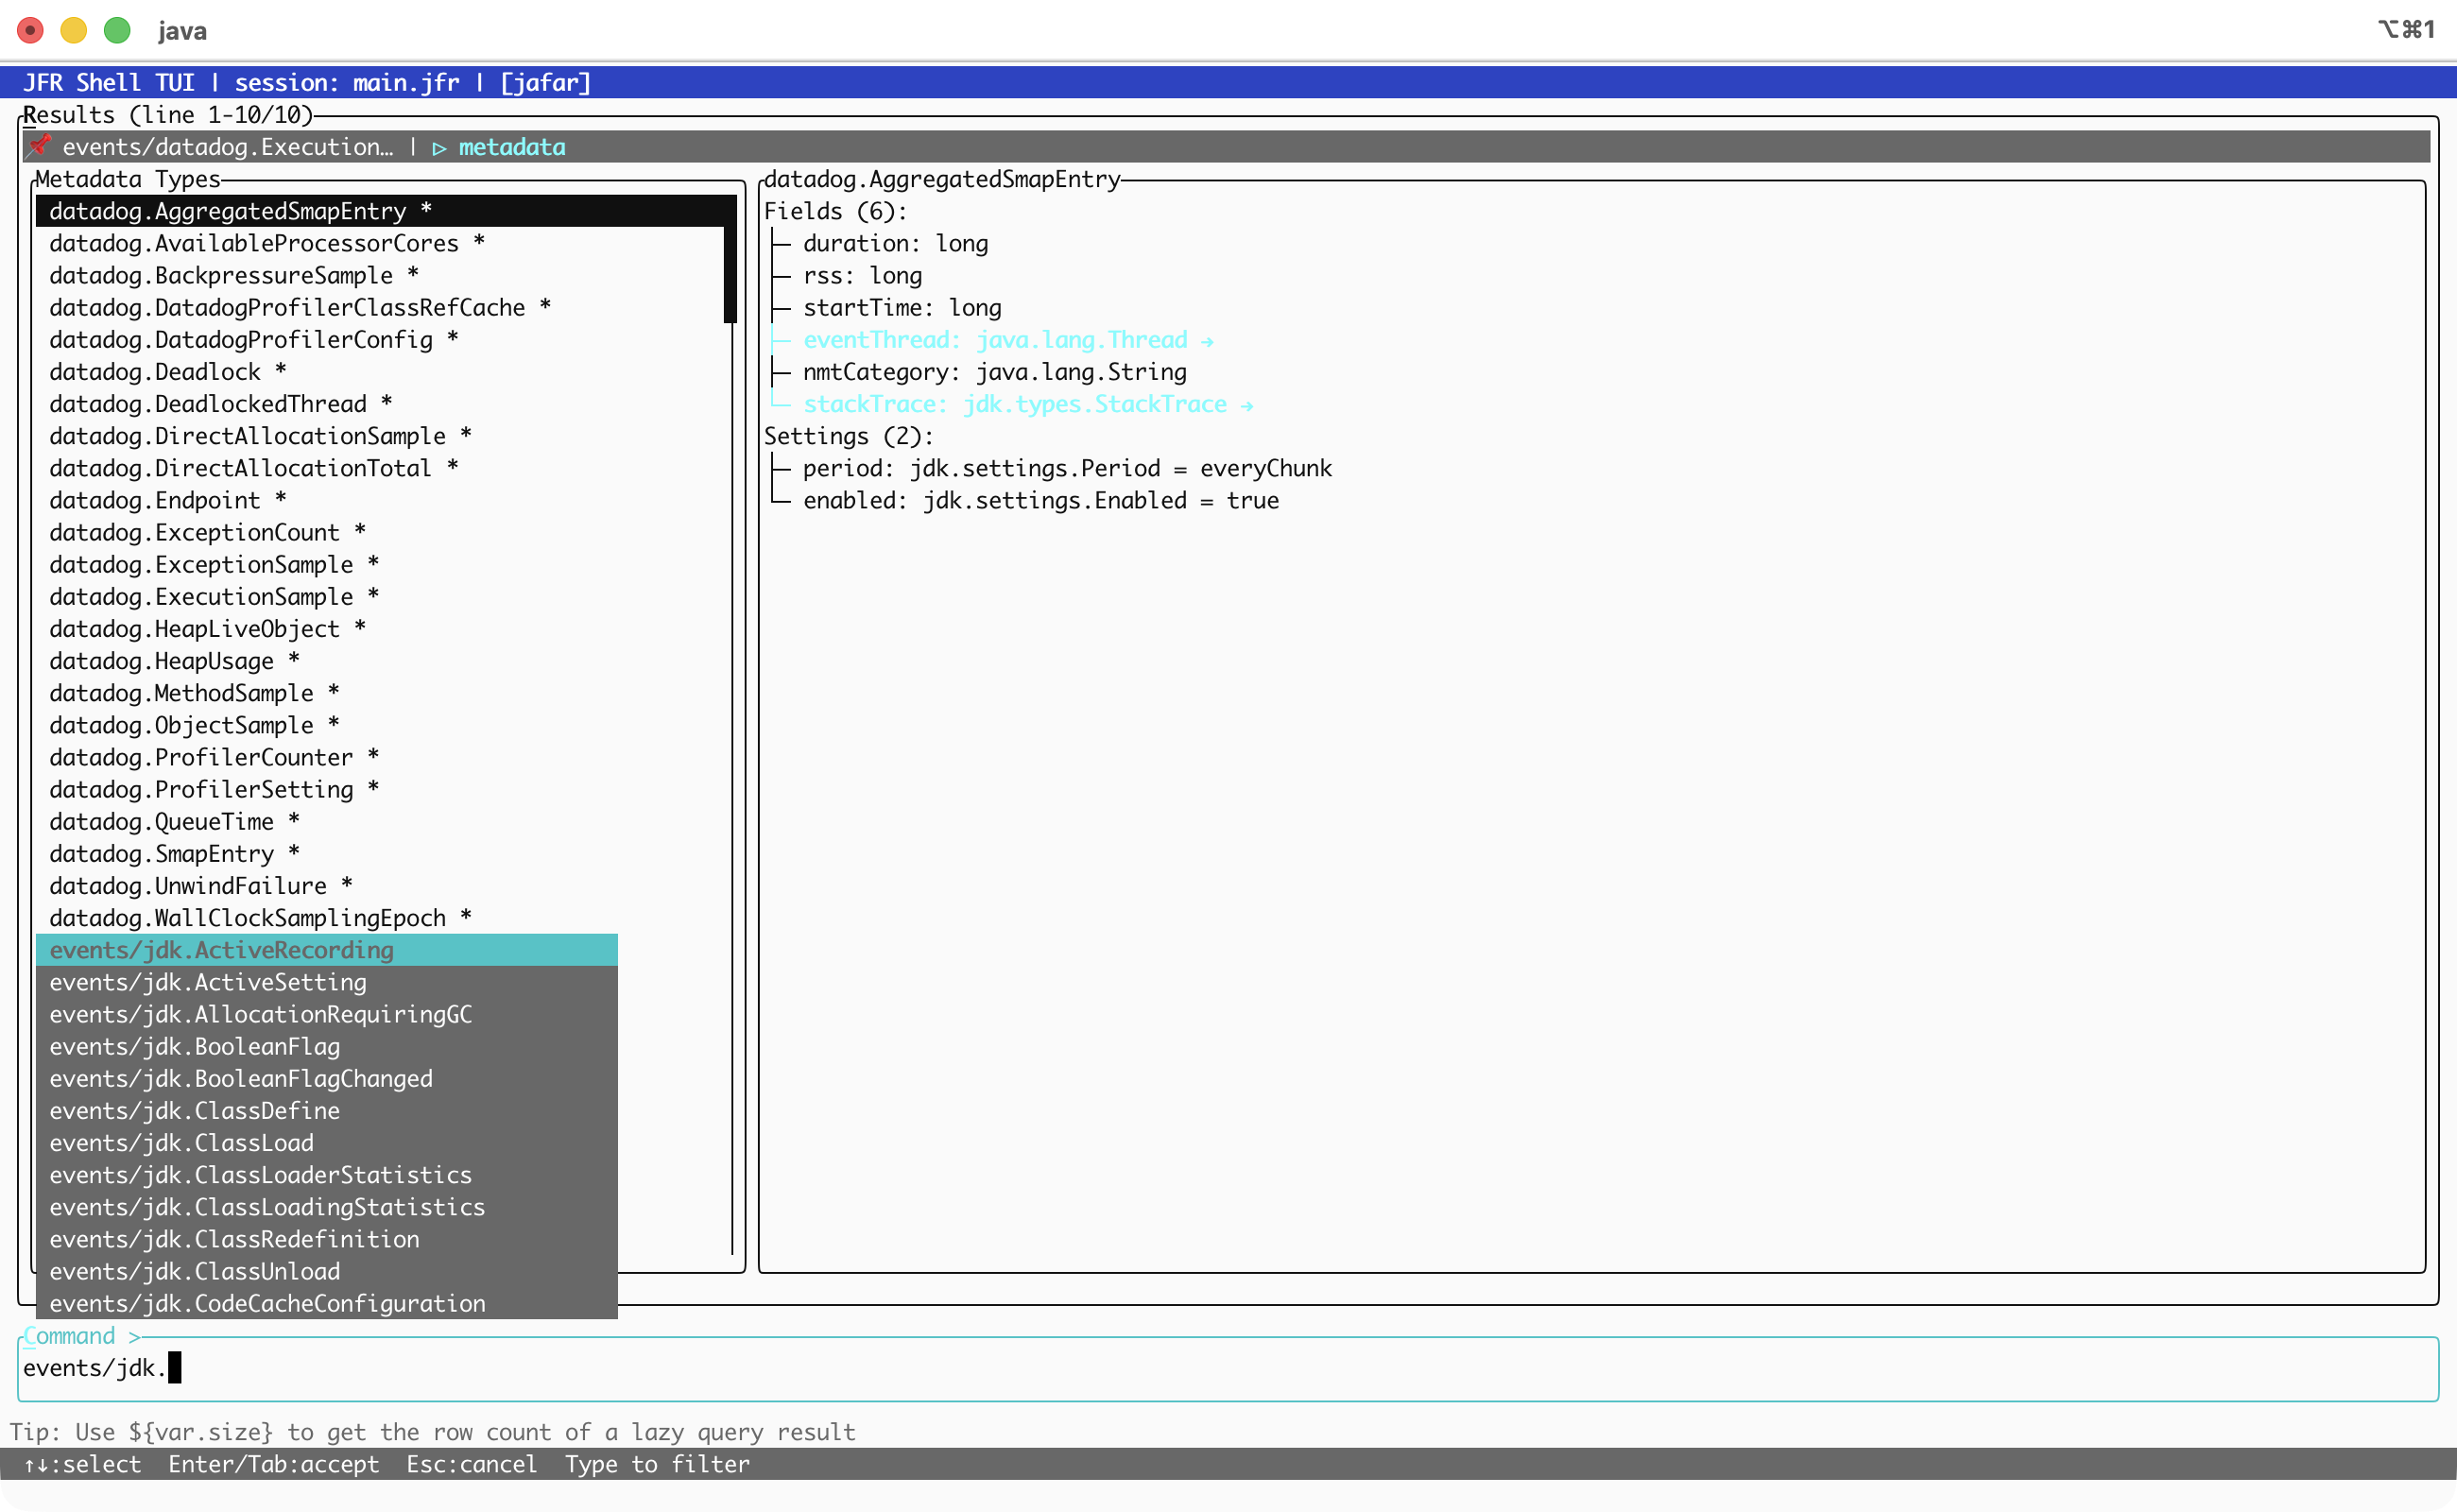
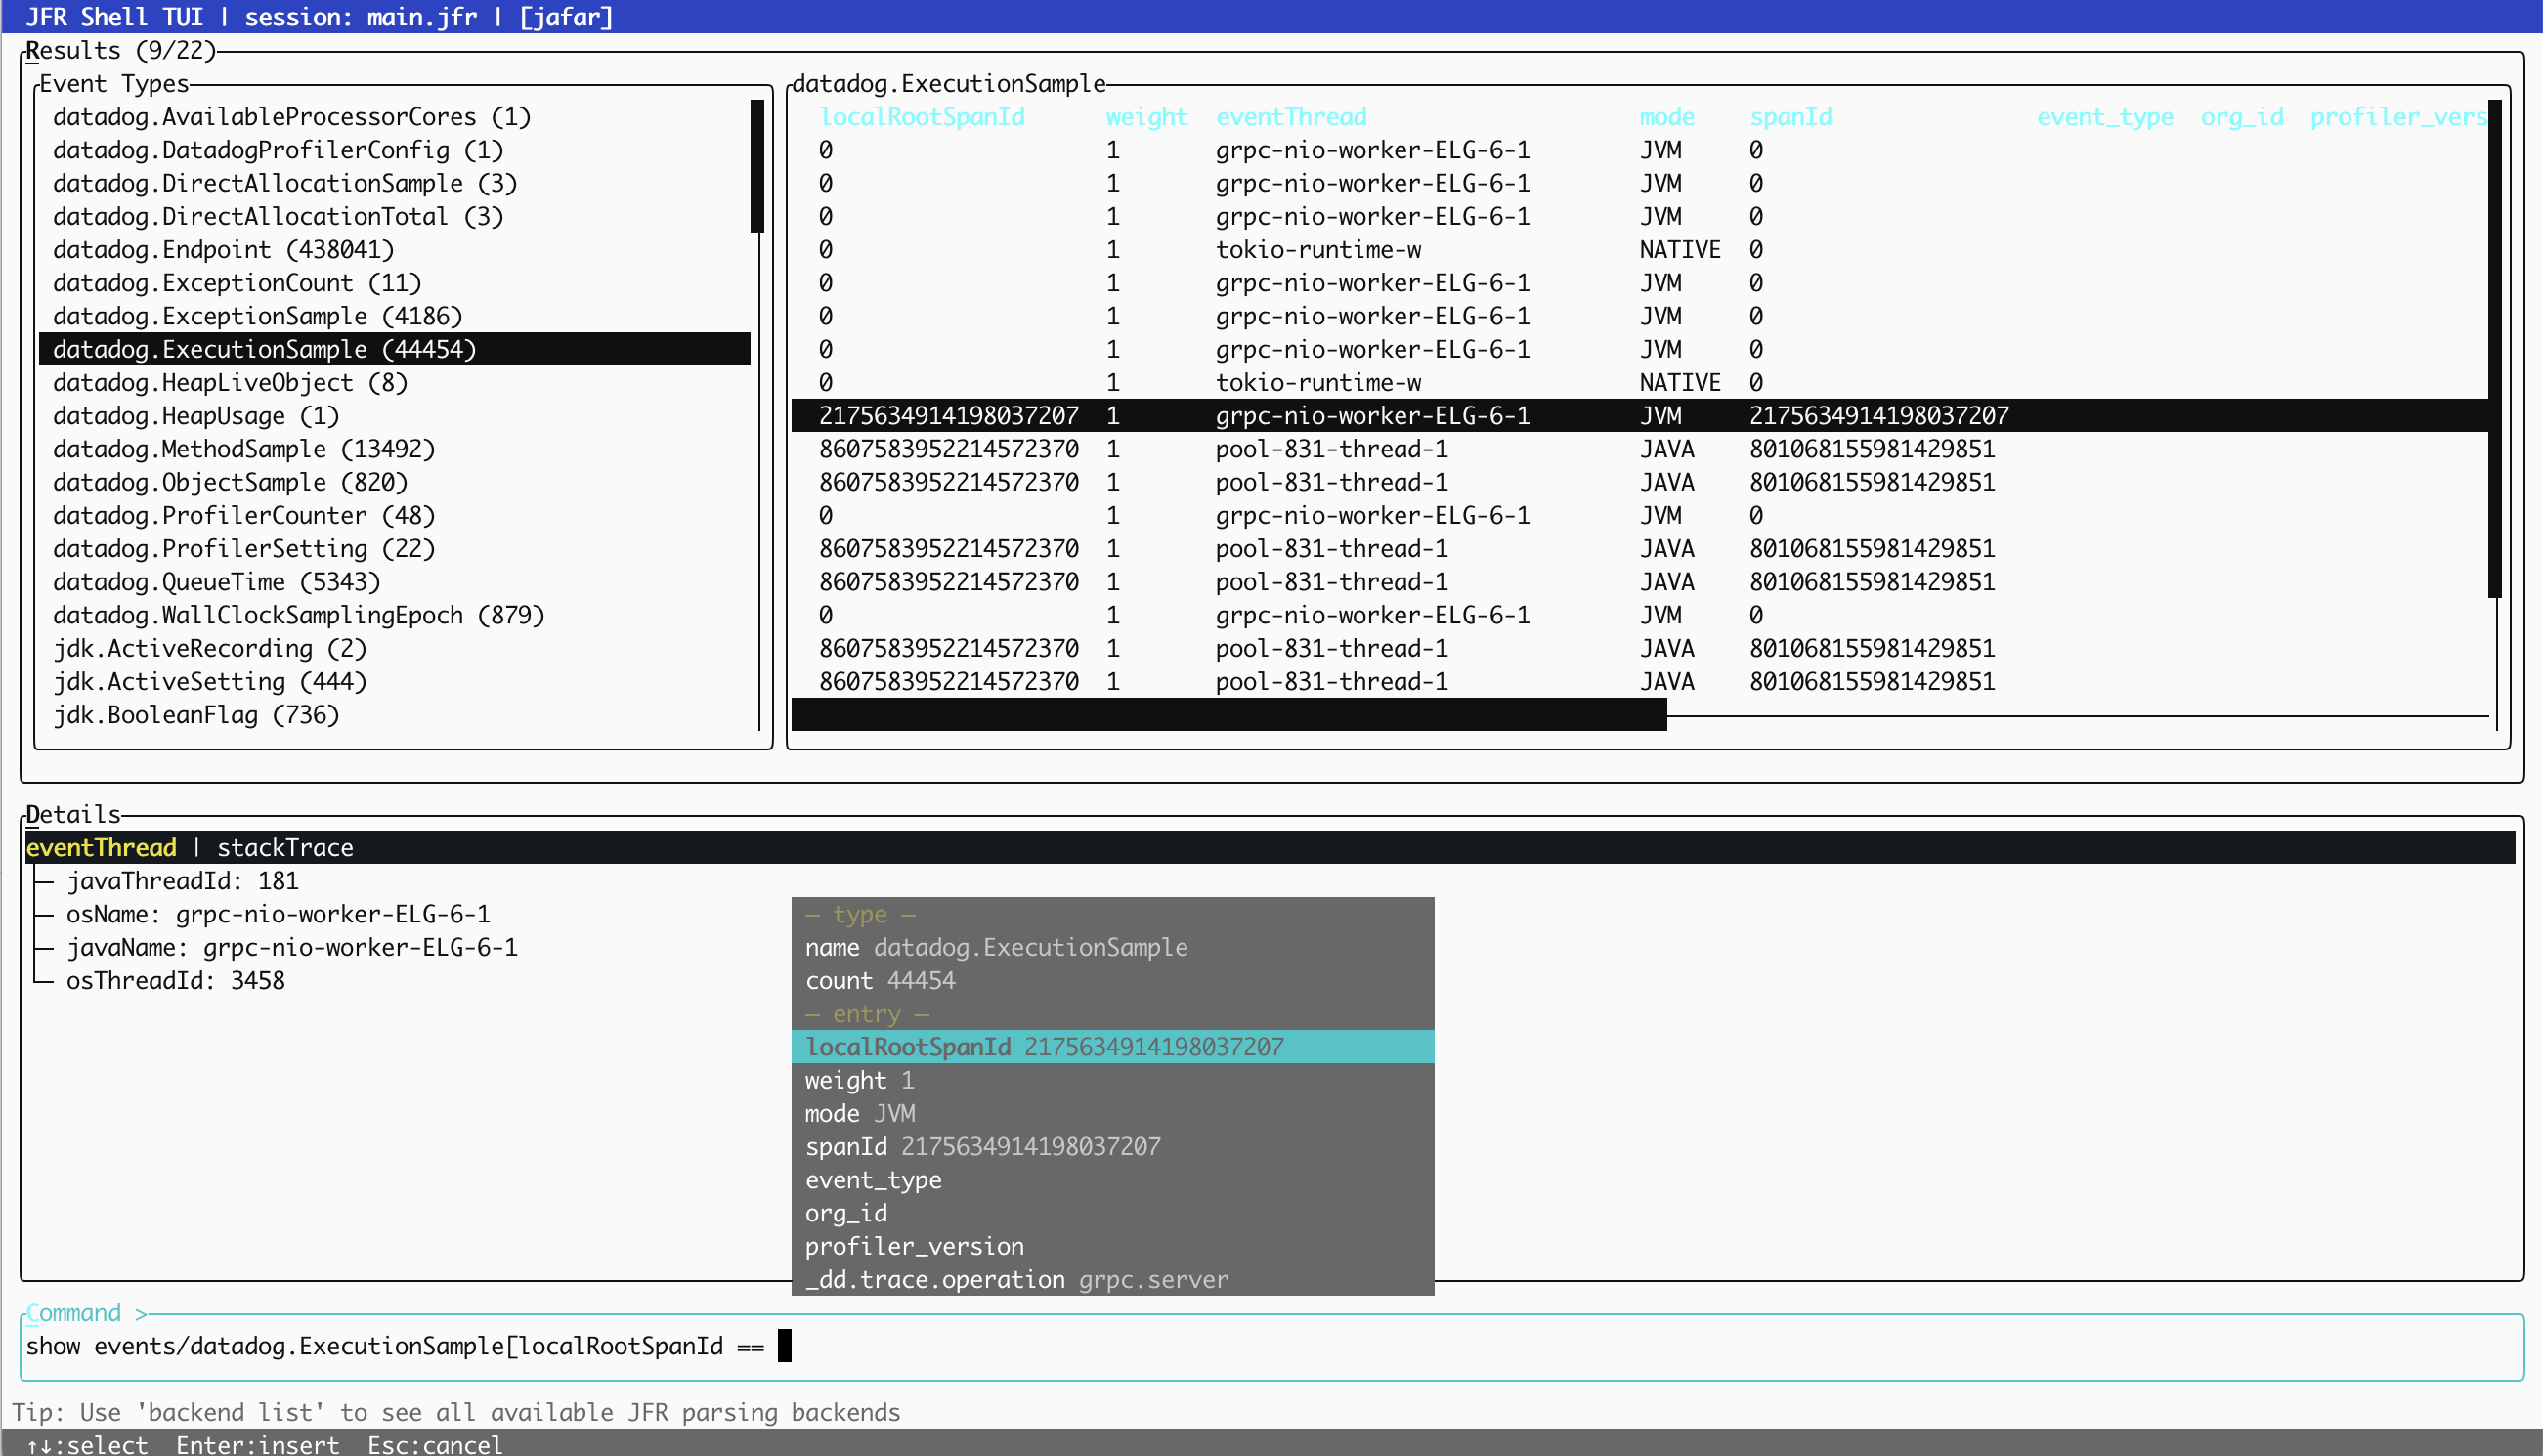
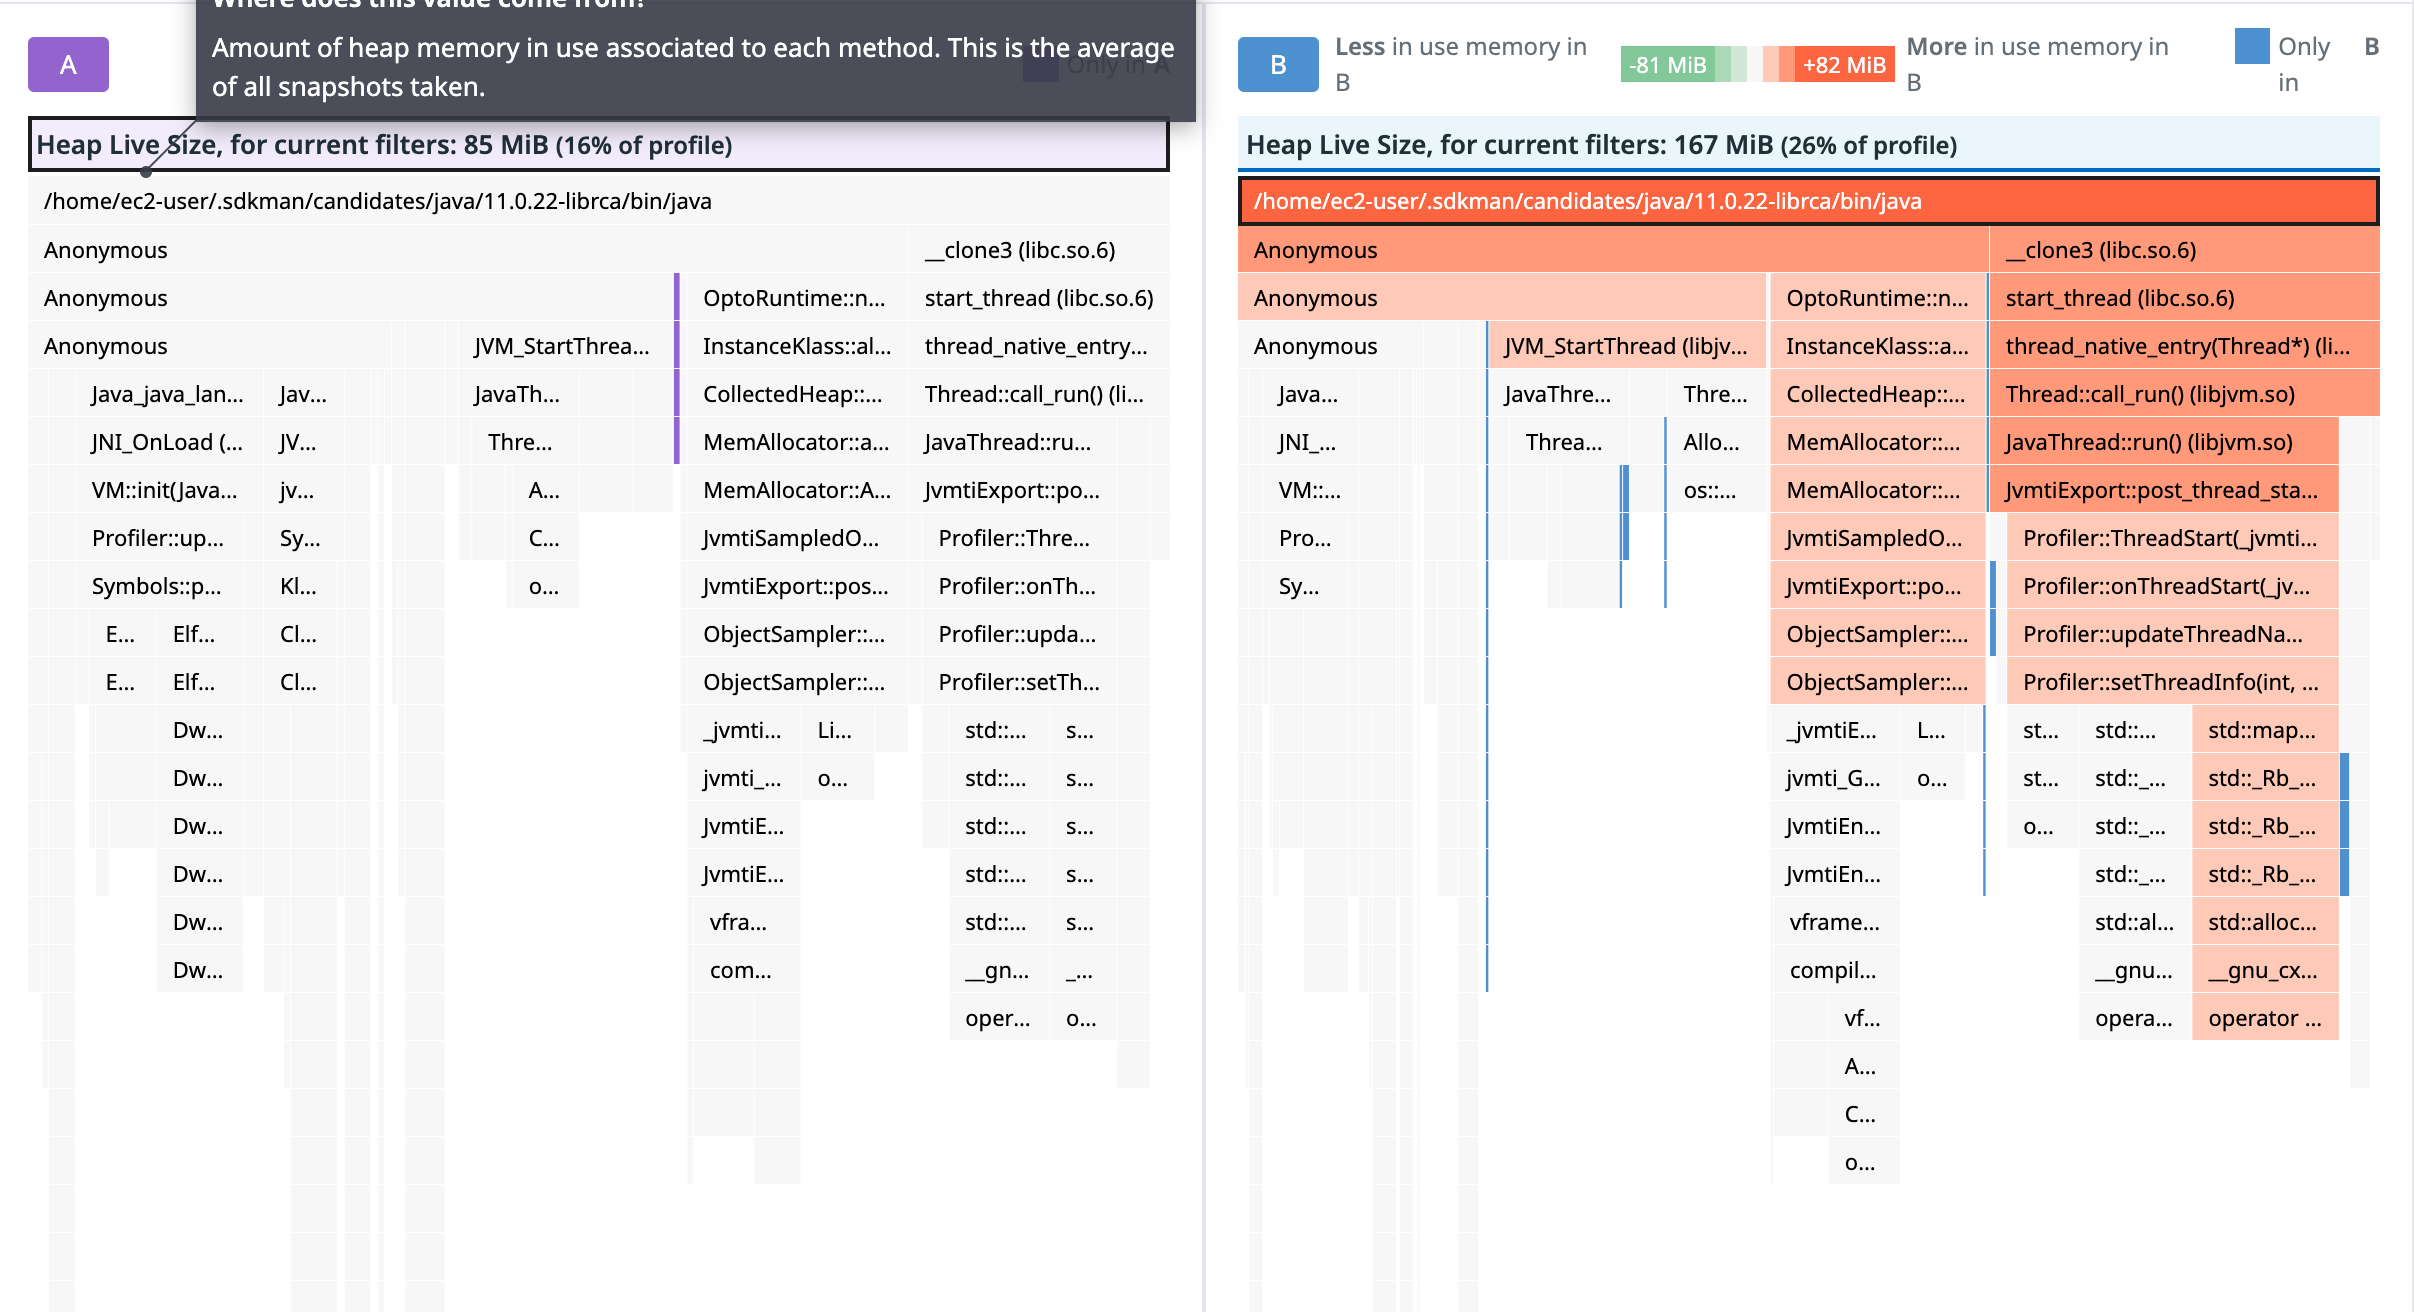
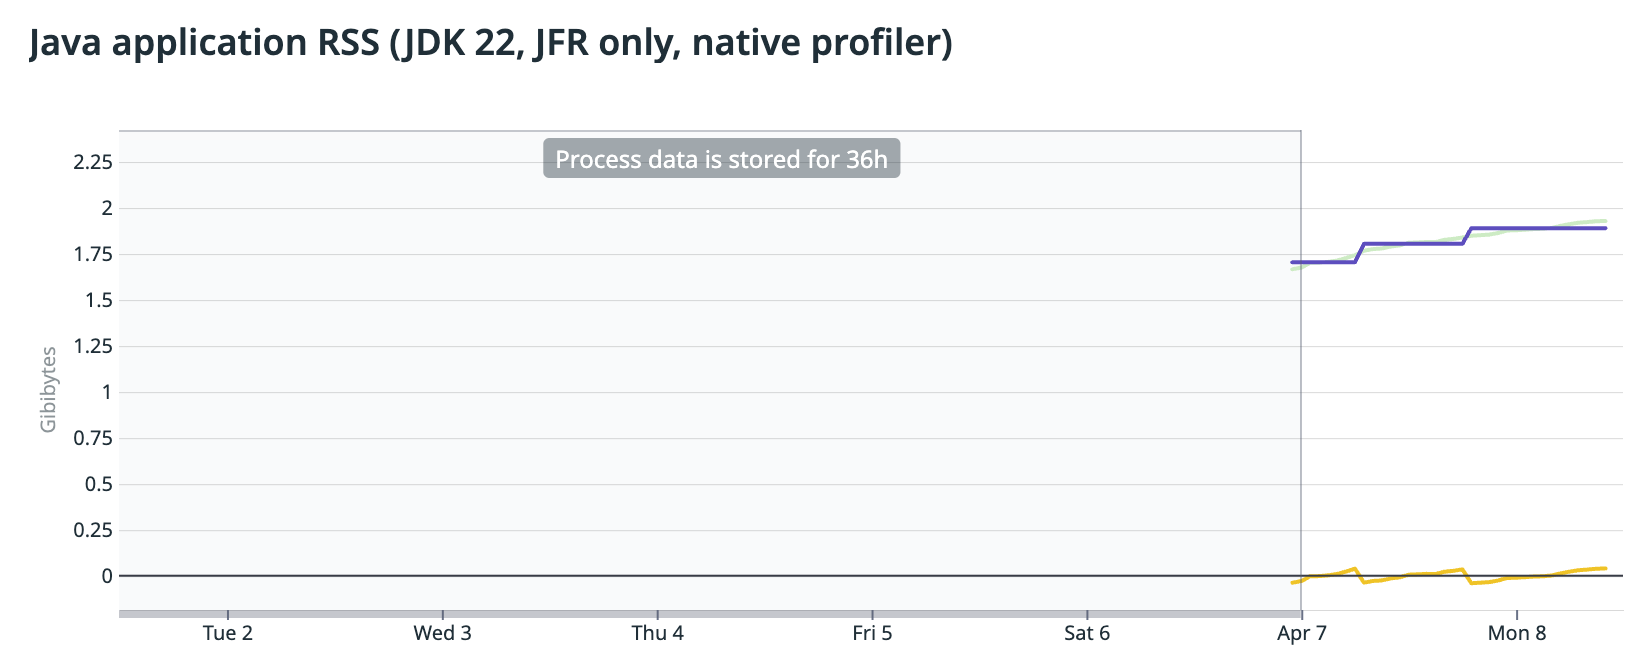
<?xml version="1.0" encoding="utf-8"?><feed xmlns="http://www.w3.org/2005/Atom" ><generator uri="https://jekyllrb.com/" version="3.10.0">Jekyll</generator><link href="/feed.xml" rel="self" type="application/atom+xml" /><link href="/" rel="alternate" type="text/html" /><updated>2026-03-18T19:24:58+00:00</updated><id>/feed.xml</id><title type="html">With Enthusiasm</title><subtitle>Mostly Java/JVM stuff. Focused on serviceability, observability and performance. All opinions are my own and I am not selling any of them.</subtitle><entry><title type="html">Connecting the Dots in a JFR Recording</title><link href="/posts/decorateby-cross-signal-jfr" rel="alternate" type="text/html" title="Connecting the Dots in a JFR Recording" /><published>2026-03-18T00:00:00+00:00</published><updated>2026-03-18T00:00:00+00:00</updated><id>/posts/decorateby-cross-signal-jfr</id><content type="html" xml:base="/posts/decorateby-cross-signal-jfr"><![CDATA[<ol id="markdown-toc">
  <li><a href="#one-recording-many-silos" id="markdown-toc-one-recording-many-silos">One Recording, Many Silos</a></li>
  <li><a href="#the-hard-way" id="markdown-toc-the-hard-way">The Hard Way</a></li>
  <li><a href="#decorateby" id="markdown-toc-decorateby">decorateBy</a></li>
  <li><a href="#a-recording-to-play-with" id="markdown-toc-a-recording-to-play-with">A Recording to Play With</a></li>
  <li><a href="#five-queries" id="markdown-toc-five-queries">Five Queries</a>    <ol>
      <li><a href="#1-where-does-the-cpu-actually-go" id="markdown-toc-1-where-does-the-cpu-actually-go">1. Where does the CPU actually go?</a></li>
      <li><a href="#2-which-endpoint-is-driving-gc" id="markdown-toc-2-which-endpoint-is-driving-gc">2. Which endpoint is driving GC?</a></li>
      <li><a href="#3-wall-clock-profile-by-trace-operation" id="markdown-toc-3-wall-clock-profile-by-trace-operation">3. Wall-clock profile by trace operation</a></li>
      <li><a href="#4-how-much-cpu-is-spent-on-failing-traces" id="markdown-toc-4-how-much-cpu-is-spent-on-failing-traces">4. How much CPU is spent on failing traces?</a></li>
      <li><a href="#5-heap-allocations-by-wall-clock-thread-state" id="markdown-toc-5-heap-allocations-by-wall-clock-thread-state">5. Heap allocations by wall-clock thread state</a></li>
    </ol>
  </li>
  <li><a href="#why-this-matters" id="markdown-toc-why-this-matters">Why This Matters</a></li>
</ol>

<h2 id="one-recording-many-silos">One Recording, Many Silos</h2>

<p>A JFR recording from a busy service is absurdly rich. CPU samples, allocation samples, GC pauses, exceptions, thread states, endpoint spans, lock contention events. All timestamped, all in the same file, all covering the same two minutes of life.</p>

<p>And yet, almost everyone analyzes them one event type at a time.</p>

<p>You look at CPU samples. You see hot methods. You look at allocations. You see big objects. You look at exceptions. You see error counts. Each view is correct, but each is also incomplete. The interesting questions are the ones that span two views at once. Which endpoint is responsible for GC pressure? Are the exceptions actually correlated with CPU waste, or are they harmless? Do threads allocate memory while they are parked and waiting?</p>

<p>These are not exotic questions. They are the first things a performance engineer wants to know when triaging a production incident. The data to answer them is right there in the recording. The problem has always been connecting it.</p>

<h2 id="the-hard-way">The Hard Way</h2>

<p>Suppose you have a recording with 44,000 CPU samples and 438,000 endpoint span events. You want to know how much CPU each endpoint consumes.</p>

<p>Both event types carry a <code class="language-plaintext highlighter-rouge">localRootSpanId</code> field that identifies the distributed trace they belong to. In theory, you just join them on that field. In practice, that means:</p>

<ol>
  <li>Export all execution samples with their span IDs</li>
  <li>Export all endpoint events with their span IDs and endpoint names</li>
  <li>Load both into a script or a spreadsheet</li>
  <li>Join on span ID</li>
  <li>Group by endpoint name</li>
  <li>Count</li>
</ol>

<p>It works. It’s also tedious enough that nobody does it during an incident at 3am. You end up eyeballing thread names in the flamegraph and hoping they correlate with something useful.</p>

<p>If you want to cross allocations with exceptions on the same trace, that’s another export, another join, another script. Each question is a small project. So in practice, people don’t ask these questions. They stick to single-event-type queries and miss the connections.</p>

<h2 id="decorateby">decorateBy</h2>

<p>jfr-shell has an operator called <code class="language-plaintext highlighter-rouge">decorateBy</code> that does this join inline, as part of a query pipeline. You tell it which event type to use as context, which field to join on, and which fields to pull from it. The result is the original events enriched with fields from the second type, accessible as <code class="language-plaintext highlighter-rouge">$decorator.*</code> in downstream operators like <code class="language-plaintext highlighter-rouge">groupBy</code> or <code class="language-plaintext highlighter-rouge">select</code>.</p>

<p>There are two flavors. <code class="language-plaintext highlighter-rouge">decorateByTime</code> matches events that overlap in time on the same thread, useful for things like “which lock was this thread waiting on when this sample was taken.” <code class="language-plaintext highlighter-rouge">decorateByKey</code> matches events that share a value in a specified field, useful for any kind of ID-based correlation: trace IDs, span IDs, request IDs, GC cycle IDs.</p>

<p>The query for “CPU budget per endpoint” looks like this:</p>

<div class="language-plaintext highlighter-rouge"><div class="highlight"><pre class="highlight"><code>events/datadog.ExecutionSample
  | decorateByKey(datadog.Endpoint,
      key=localRootSpanId, decoratorKey=localRootSpanId,
      fields=endpoint)
  | groupBy($decorator.endpoint)
</code></pre></div></div>

<p>One query. No exports, no scripts, no spreadsheets. Takes a few seconds to run. And because it’s just another pipeline operator, you can chain it with everything else: filters, aggregations, top-N, sorting.</p>

<h2 id="a-recording-to-play-with">A Recording to Play With</h2>

<p>I had a recording from a gRPC-based profile analysis service. Two minutes, 16 megabytes. Here’s what was in it:</p>

<ul>
  <li><strong>44,454</strong> CPU execution samples (Datadog async profiler)</li>
  <li><strong>13,492</strong> method samples with trace correlation</li>
  <li><strong>4,186</strong> exception samples</li>
  <li><strong>820</strong> allocation samples</li>
  <li><strong>438,041</strong> endpoint span events</li>
  <li><strong>116</strong> GC pauses, including one full GC at 3.6 seconds</li>
  <li>8 cpu-intensive worker threads, gRPC/Netty I/O threads, a Kafka consumer</li>
</ul>

<p>The Datadog profiler puts a <code class="language-plaintext highlighter-rouge">localRootSpanId</code> on most of its events. This is the distributed trace root. When an execution sample, an allocation sample, and an endpoint event share the same <code class="language-plaintext highlighter-rouge">localRootSpanId</code>, they all belong to the same request. That is the join key for everything that follows.</p>

<h2 id="five-queries">Five Queries</h2>

<h3 id="1-where-does-the-cpu-actually-go">1. Where does the CPU actually go?</h3>

<div class="language-plaintext highlighter-rouge"><div class="highlight"><pre class="highlight"><code>events/datadog.ExecutionSample
  | decorateByKey(datadog.Endpoint,
      key=localRootSpanId, decoratorKey=localRootSpanId,
      fields=endpoint)
  | groupBy($decorator.endpoint)
</code></pre></div></div>

<div class="language-plaintext highlighter-rouge"><div class="highlight"><pre class="highlight"><code>| endpoint                                 | count |
+------------------------------------------+-------+
| (untraced)                               | 23578 |
| com.datadoghq.profiling.analyzer.Analyz… | 19270 |
| processProfileRecord                     |  1418 |
| libstreamingFetch                        |   153 |
| SubmitSeries                             |    35 |
</code></pre></div></div>

<p>53% of CPU has no trace context at all. That’s GC threads, Kafka housekeeping, JIT compilation, internal bookkeeping. The main gRPC <code class="language-plaintext highlighter-rouge">Analyze</code> endpoint takes 43%. And there’s a <code class="language-plaintext highlighter-rouge">processProfileRecord</code> step eating 3.2% that you’d never notice in a flat flamegraph because it gets mixed in with everything else.</p>

<p>Before this query, you have 44,000 undifferentiated samples. After it, you have an endpoint-level CPU budget.</p>

<h3 id="2-which-endpoint-is-driving-gc">2. Which endpoint is driving GC?</h3>

<div class="language-plaintext highlighter-rouge"><div class="highlight"><pre class="highlight"><code>events/datadog.ObjectSample
  | decorateByKey(datadog.Endpoint,
      key=localRootSpanId, decoratorKey=localRootSpanId,
      fields=endpoint)
  | groupBy($decorator.endpoint, agg=sum, value=weight)
</code></pre></div></div>

<div class="language-plaintext highlighter-rouge"><div class="highlight"><pre class="highlight"><code>| endpoint                                 | allocation weight |
+------------------------------------------+-------------------|
| com.datadoghq.profiling.analyzer.Analyz… |      1,237,346 KB |
| (untraced)                               |        161,972 KB |
| processProfileRecord                     |         94,296 KB |
| libstreamingFetch                        |          2,396 KB |
</code></pre></div></div>

<p>Same idea, different signal. The gRPC <code class="language-plaintext highlighter-rouge">Analyze</code> endpoint is responsible for 83% of all allocation weight: about 1.2 GB in two minutes. That’s almost certainly what’s feeding the 116 GC pauses and the 3.6-second full GC.</p>

<p>When you see 116 GC pauses in a summary, the natural question is “caused by what?” Allocation profiling alone tells you which object types are hot, but not which business operation produced them. This one query connects the two.</p>

<h3 id="3-wall-clock-profile-by-trace-operation">3. Wall-clock profile by trace operation</h3>

<div class="language-plaintext highlighter-rouge"><div class="highlight"><pre class="highlight"><code>events/datadog.MethodSample
  | decorateByKey(datadog.Endpoint,
      key=localRootSpanId, decoratorKey=localRootSpanId,
      fields=operation)
  | groupBy($decorator.operation)
</code></pre></div></div>

<div class="language-plaintext highlighter-rouge"><div class="highlight"><pre class="highlight"><code>| operation            | count |
+----------------------+-------+
| grpc.server          | 10686 |
| processProfileRecord |  1017 |
| (unmatched)          |  1697 |
| libstreamingFetch    |    82 |
| SubmitSeries         |    10 |
</code></pre></div></div>

<p><code class="language-plaintext highlighter-rouge">MethodSample</code> events are wall-clock samples. They capture what threads are doing regardless of whether they are on CPU or waiting. That makes this a different lens than query #1: it includes time threads spend parked, blocked, or sleeping. Decorating them with the endpoint’s <code class="language-plaintext highlighter-rouge">operation</code> field shows that <code class="language-plaintext highlighter-rouge">grpc.server</code> dominates at 79% of traced wall-clock time. That’s surprising, because the heavy lifting in this service is <code class="language-plaintext highlighter-rouge">processProfileRecord</code>, the step that actually analyzes incoming profiles. It only accounts for 7.5% here. So the question becomes: what’s the gRPC layer doing with all that time? Is it serialization overhead, TLS, frame handling? The wall-clock view raises questions that a CPU-only profile would not.</p>

<h3 id="4-how-much-cpu-is-spent-on-failing-traces">4. How much CPU is spent on failing traces?</h3>

<p>This one is my favorite.</p>

<div class="language-plaintext highlighter-rouge"><div class="highlight"><pre class="highlight"><code>events/datadog.ExecutionSample
  | decorateByKey(datadog.ExceptionSample,
      key=localRootSpanId, decoratorKey=localRootSpanId,
      fields=sampled)
  | groupBy($decorator.sampled)
</code></pre></div></div>

<div class="language-plaintext highlighter-rouge"><div class="highlight"><pre class="highlight"><code>| error-tainted? | count |
+----------------+-------+
| true           | 22529 |
| (clean/none)   | 21925 |
</code></pre></div></div>

<p>This doesn’t correlate CPU with endpoints. It correlates CPU with exceptions. Every CPU sample whose trace also threw at least one exception gets tagged. Every sample from a clean trace, or from background work with no trace at all, falls into the other bucket.</p>

<p>The result: <strong>50.7% of all CPU is spent on traces that also threw at least one exception.</strong></p>

<p>Now, a caveat. The profiler tracks all exceptions, caught and uncaught alike. A <code class="language-plaintext highlighter-rouge">try/catch</code> around a socket timeout still produces an exception sample. So “error-tainted” doesn’t necessarily mean “failing.” Some of those traces might be perfectly healthy code paths that just happen to use exceptions for control flow (looking at you, Java I/O).</p>

<p>Still, 50% is a striking number. It tells you that half your compute shares traces with exception activity. Whether that is harmless or a real problem, you now know where to look. Filter those traces by exception type and you will quickly separate the expected <code class="language-plaintext highlighter-rouge">EOFException</code> noise from the real errors.</p>

<h3 id="5-heap-allocations-by-wall-clock-thread-state">5. Heap allocations by wall-clock thread state</h3>

<div class="language-plaintext highlighter-rouge"><div class="highlight"><pre class="highlight"><code>events/datadog.ObjectSample
  | decorateByKey(datadog.MethodSample,
      key=localRootSpanId, decoratorKey=localRootSpanId,
      fields=state)
  | groupBy($decorator.state, agg=sum, value=weight)
</code></pre></div></div>

<div class="language-plaintext highlighter-rouge"><div class="highlight"><pre class="highlight"><code>| thread state | allocation weight |
+--------------+-------------------|
| RUNNABLE     |      1,046,390 KB |
| (unmatched)  |        261,461 KB |
| PARKED       |        188,159 KB |
</code></pre></div></div>

<p>This joins two completely different profiling signals: heap allocation samples and wall-clock thread state samples, correlated by trace. For each allocation, it grabs a wall-clock sample from the same trace and pulls the thread state at that moment.</p>

<p>A word of caution: this is a loose correlation. <code class="language-plaintext highlighter-rouge">decorateByKey</code> picks one wall-clock sample from the matching trace. It doesn’t tell you what the thread was doing at the exact instant of the allocation. What it does tell you is whether a given trace was predominantly active or idle during the recording window.</p>

<p>With that in mind: 1 GB of heap allocations belong to traces that also show RUNNABLE wall-clock activity. No surprise there. But 188 MB belong to traces where the sampled state was PARKED. That doesn’t prove the thread was parked when it allocated, but it flags those traces as worth a closer look. Why is a trace that spends time parked also producing meaningful heap pressure?</p>

<h2 id="why-this-matters">Why This Matters</h2>

<p>Every one of these queries takes two things that JFR already records and asks a question that neither can answer alone. CPU samples don’t know which endpoint they serve. Allocation samples don’t know if their trace threw an exception. Exception counts don’t know how much CPU the failing traces consumed.</p>

<p>The data was always there. The recording has always contained all of it. What was missing was a way to connect the signals without leaving the query language and reaching for external scripts.</p>

<p><code class="language-plaintext highlighter-rouge">decorateBy</code> is that connection. And it’s not limited to Datadog-specific events. Standard JDK events work the same way. Decorate execution samples with <code class="language-plaintext highlighter-rouge">jdk.JavaMonitorEnter</code> by time overlap to find CPU under lock contention. Decorate allocation samples with GC phase events to find which allocations happen during collection. Decorate file reads with endpoint spans to attribute I/O to business operations. Any two event types in the same recording can be joined, as long as they share a time range or a key field.</p>

<p>The recording is always richer than a single-event-type query can show. Most of the interesting performance stories live in the space between two signals.</p>

<blockquote>
  <p><strong>Sidebar: the bug that almost ate this post.</strong>
When I first ran these queries, every single one returned zero matches. It turned out there was a path-navigation bug in <code class="language-plaintext highlighter-rouge">DecoratedEventMap</code>: the <code class="language-plaintext highlighter-rouge">$decorator.field</code> path was being split into two steps (<code class="language-plaintext highlighter-rouge">"$decorator"</code> then <code class="language-plaintext highlighter-rouge">"field"</code>), but the map only recognized the full string <code class="language-plaintext highlighter-rouge">"$decorator.field"</code> as a single key. A <a href="https://github.com/btraceio/jafar/commit/3cfad01">four-line fix</a> made the bare <code class="language-plaintext highlighter-rouge">"$decorator"</code> lookup return the decorator map directly, and everything started working. Lesson: when your feature silently returns empty results for every input, it’s probably not a data problem.</p>
</blockquote>

<hr />

<p><em>jfr-shell is part of <a href="https://github.com/btraceio/jafar">JAFAR</a> and available via <a href="https://jbang.dev">JBang</a> and <a href="https://central.sonatype.com/">Maven Central</a>.</em></p>]]></content><author><name></name></author><category term="java" /><category term="jfr" /><category term="performance" /><category term="profiling" /><category term="jfr" /><category term="jfr-shell" /><category term="decorateBy" /><category term="profiling" /><category term="jafar" /><category term="cross-signal" /><summary type="html"><![CDATA[]]></summary></entry><entry><title type="html">When Did That Hotspot Happen?</title><link href="/posts/stackprofile-jfr" rel="alternate" type="text/html" title="When Did That Hotspot Happen?" /><published>2026-03-13T00:00:00+00:00</published><updated>2026-03-13T00:00:00+00:00</updated><id>/posts/stackprofile-jfr</id><content type="html" xml:base="/posts/stackprofile-jfr"><![CDATA[<ol id="markdown-toc">
  <li><a href="#the-flamegraph-lie" id="markdown-toc-the-flamegraph-lie">The Flamegraph Lie</a></li>
  <li><a href="#what-you-actually-want" id="markdown-toc-what-you-actually-want">What You Actually Want</a></li>
  <li><a href="#stackprofile" id="markdown-toc-stackprofile">stackprofile</a></li>
  <li><a href="#reading-the-output" id="markdown-toc-reading-the-output">Reading the Output</a></li>
  <li><a href="#bursty-vs-steady-a-concrete-difference" id="markdown-toc-bursty-vs-steady-a-concrete-difference">Bursty vs Steady: A Concrete Difference</a></li>
  <li><a href="#flamegraph-vs-stackprofile" id="markdown-toc-flamegraph-vs-stackprofile">Flamegraph vs stackprofile</a></li>
  <li><a href="#prior-art-and-how-stackprofile-differs" id="markdown-toc-prior-art-and-how-stackprofile-differs">Prior Art and How stackprofile Differs</a></li>
  <li><a href="#for-ai-agents-too" id="markdown-toc-for-ai-agents-too">For AI Agents Too</a></li>
  <li><a href="#where-it-shines" id="markdown-toc-where-it-shines">Where It Shines</a></li>
  <li><a href="#try-it" id="markdown-toc-try-it">Try It</a></li>
</ol>

<h2 id="the-flamegraph-lie">The Flamegraph Lie</h2>

<p>Flamegraphs are the standard answer to “where is the CPU going?” You get a beautiful tree of call stacks, widths proportional to sample counts, and you can visually spot the methods that dominate. It is a deservedly popular visualization.</p>

<p>But a flamegraph aggregates everything. Two minutes of recording become one static picture. A method that burned 10% of CPU for two straight minutes looks exactly the same as a method that burned 100% of CPU for twelve seconds and was idle for the rest. Both show the same width in the graph. Both report the same sample count.</p>

<p>This matters more than you might think. The first case is a steady load, probably a core loop doing its job. The second is a burst, maybe a periodic batch, a cache rebuild, a sudden queue drain. The diagnosis is different, the fix is different, and the urgency is different. But in a flamegraph, they are the same rectangle.</p>

<h2 id="what-you-actually-want">What You Actually Want</h2>

<p>When you find a hot method in a profile, the next questions are almost always temporal:</p>

<ul>
  <li>Was it hot the entire time, or only during a spike?</li>
  <li>Is it one thread doing all the work, or is it spread across many?</li>
  <li>Is this a steady-state cost I should optimize, or a transient burst I should investigate?</li>
</ul>

<p>None of these questions can be answered by a tool that throws away the time axis.</p>

<h2 id="stackprofile">stackprofile</h2>

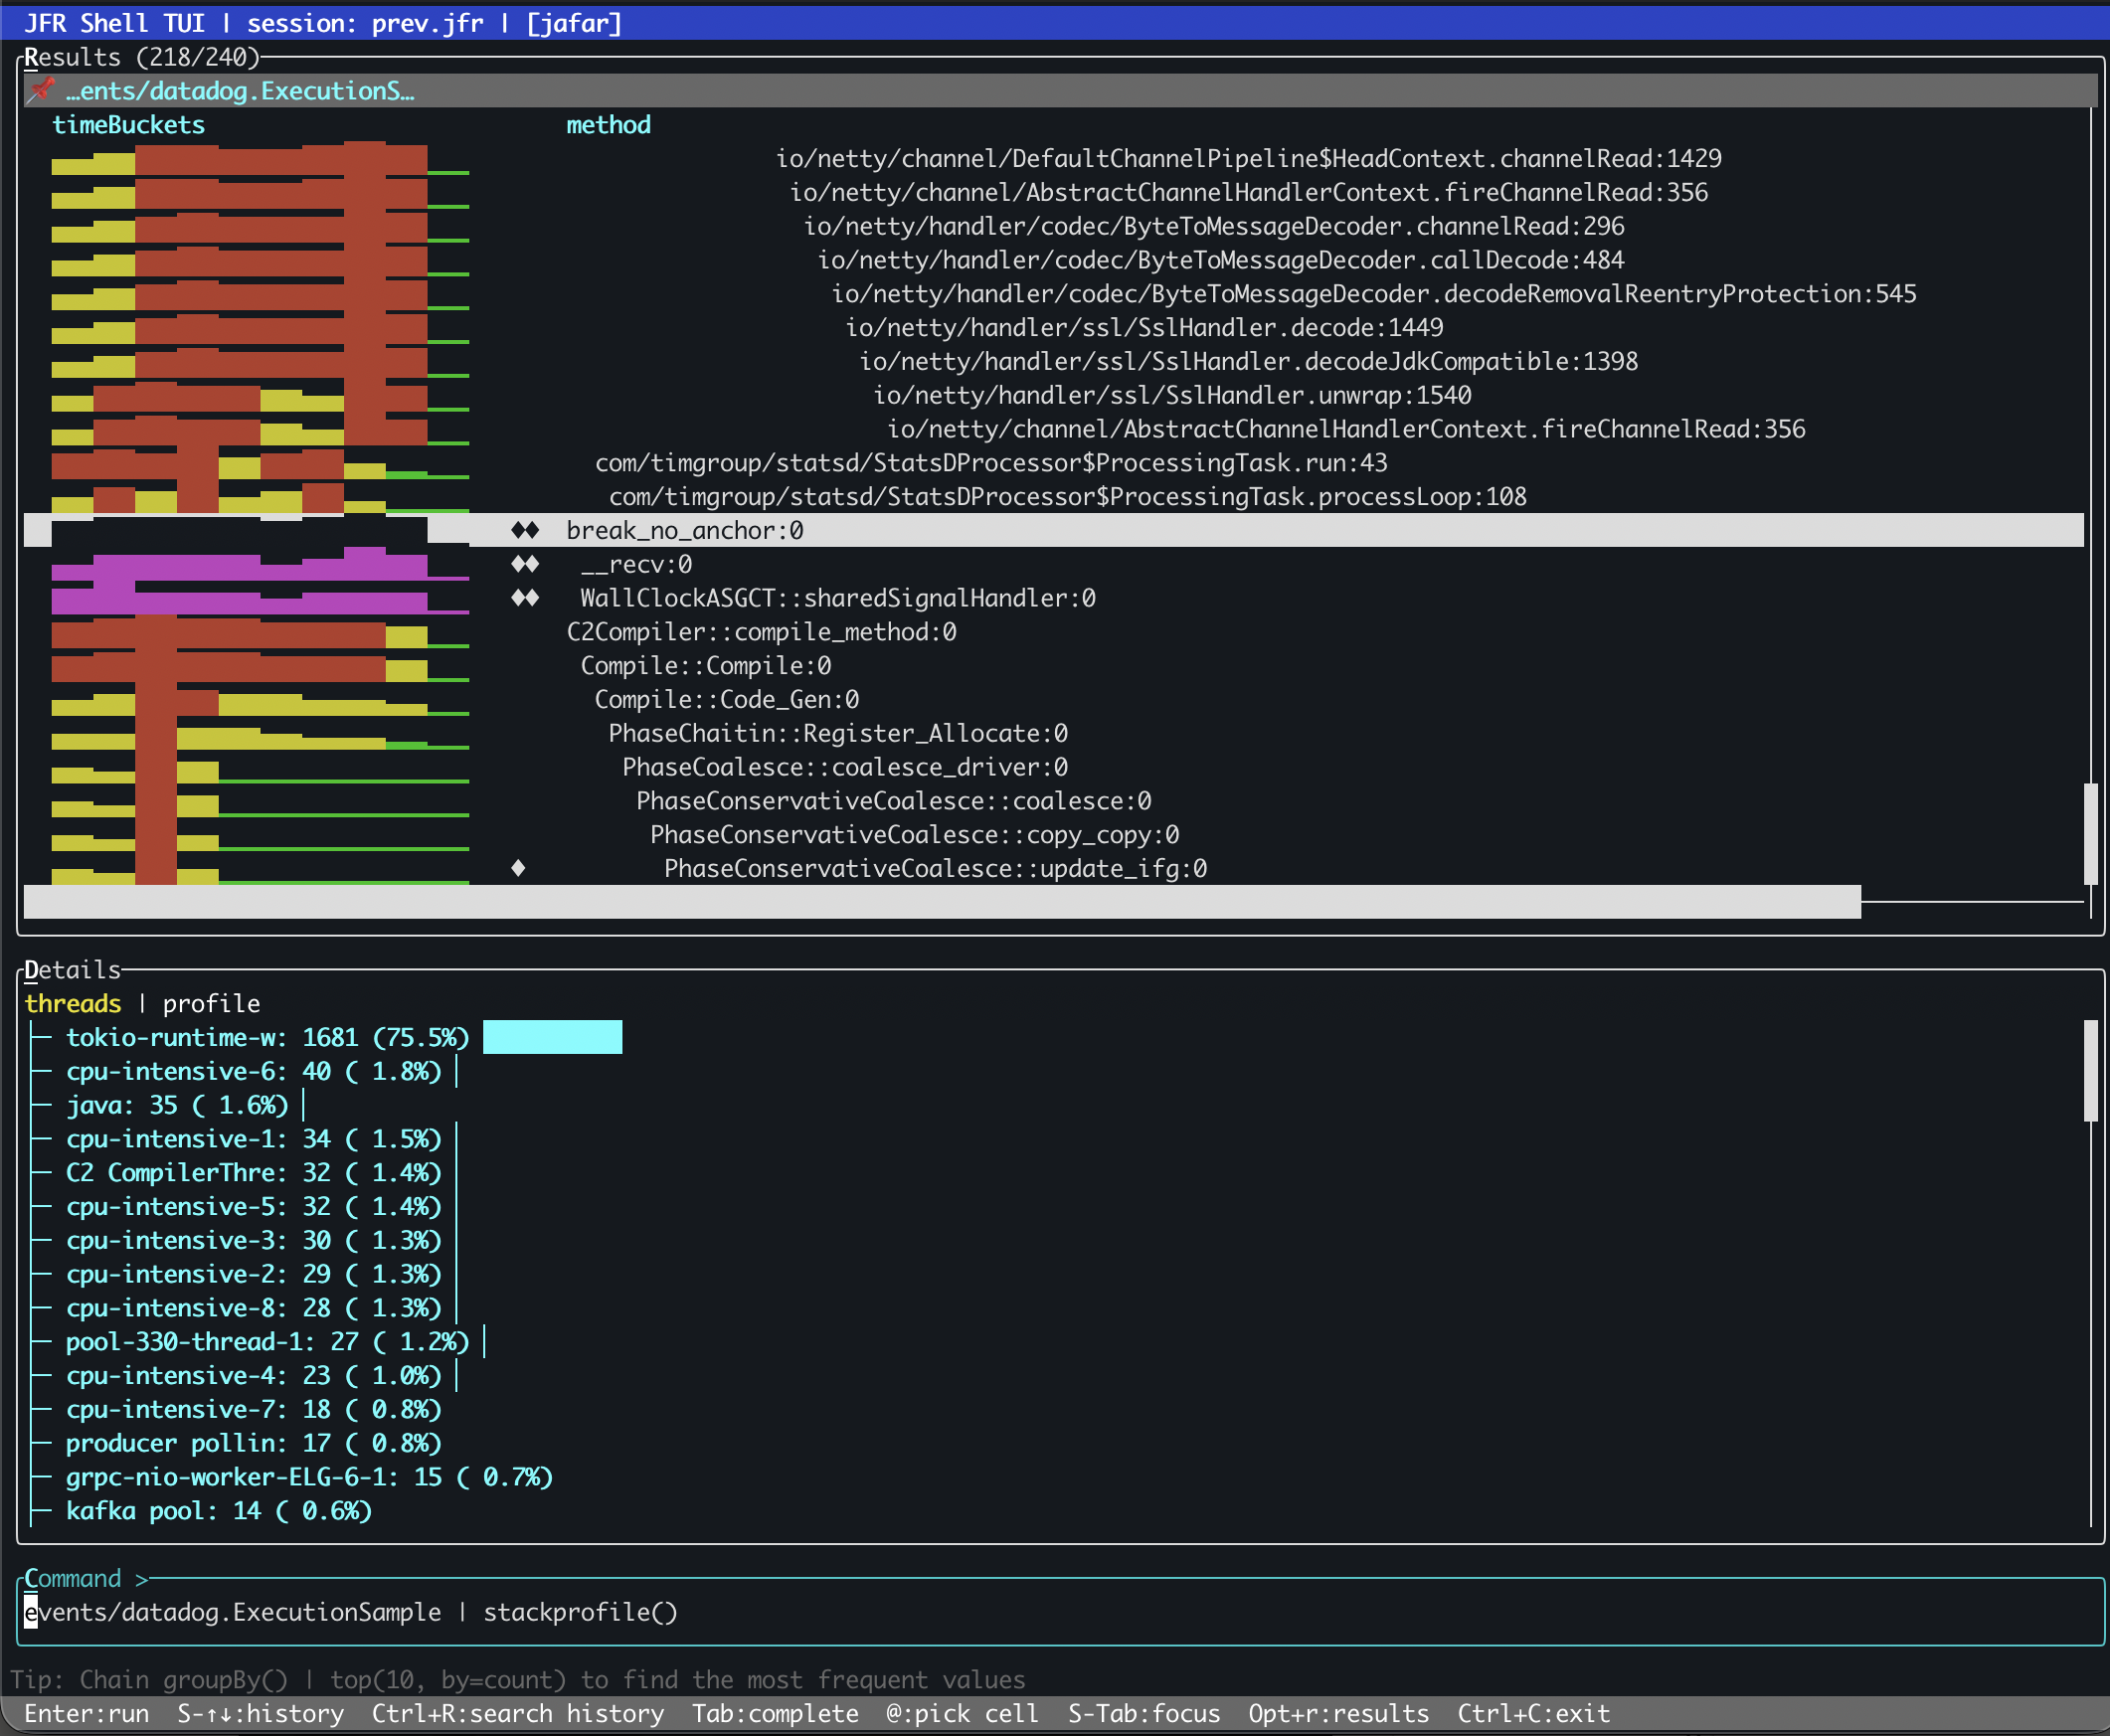
<p>jfr-shell now has a <code class="language-plaintext highlighter-rouge">stackprofile</code> pipeline operator that keeps the time axis. Instead of collapsing all samples into a single tree, it builds a weighted call tree where every node carries two extra pieces of information: a time-bucket distribution showing how samples spread over the recording duration, and a per-thread breakdown showing which threads contributed.</p>

<p>The syntax is what you would expect from a pipeline operator:</p>

<div class="language-bash highlighter-rouge"><div class="highlight"><pre class="highlight"><code>events/jdk.ExecutionSample | stackprofile<span class="o">()</span>
</code></pre></div></div>

<p>It accepts a few optional parameters:</p>

<table>
  <thead>
    <tr>
      <th>Parameter</th>
      <th>Default</th>
      <th>Meaning</th>
    </tr>
  </thead>
  <tbody>
    <tr>
      <td><code class="language-plaintext highlighter-rouge">direction</code></td>
      <td><code class="language-plaintext highlighter-rouge">top-down</code></td>
      <td><code class="language-plaintext highlighter-rouge">top-down</code> for caller paths, <code class="language-plaintext highlighter-rouge">bottom-up</code> for hot methods first</td>
    </tr>
    <tr>
      <td><code class="language-plaintext highlighter-rouge">buckets</code></td>
      <td><code class="language-plaintext highlighter-rouge">10</code></td>
      <td>Number of time buckets across the recording</td>
    </tr>
    <tr>
      <td><code class="language-plaintext highlighter-rouge">minPct</code></td>
      <td><code class="language-plaintext highlighter-rouge">1.0</code></td>
      <td>Minimum percentage threshold, prunes noise</td>
    </tr>
  </tbody>
</table>

<p>A bottom-up view with finer time resolution:</p>

<div class="language-bash highlighter-rouge"><div class="highlight"><pre class="highlight"><code>events/jdk.ExecutionSample | stackprofile<span class="o">(</span><span class="nv">direction</span><span class="o">=</span>bottom-up, <span class="nv">buckets</span><span class="o">=</span>20, <span class="nv">minPct</span><span class="o">=</span>0.5<span class="o">)</span>
</code></pre></div></div>

<h2 id="reading-the-output">Reading the Output</h2>

<p>Each row in the result is a frame in the call tree, annotated with:</p>

<ul>
  <li><strong>total</strong>: samples in this frame or any of its children</li>
  <li><strong>self</strong>: samples where this frame is the leaf (the actual work)</li>
  <li><strong>time buckets</strong>: a sparkline showing sample distribution across the recording</li>
  <li><strong>threads</strong>: per-thread sample counts with percentages</li>
</ul>

<p>The operator also classifies each frame into a category:</p>

<table>
  <thead>
    <tr>
      <th>Marker</th>
      <th>Category</th>
      <th>Meaning</th>
    </tr>
  </thead>
  <tbody>
    <tr>
      <td>(none)</td>
      <td><code class="language-plaintext highlighter-rouge">normal</code></td>
      <td>Below 1% self time</td>
    </tr>
    <tr>
      <td><code class="language-plaintext highlighter-rouge">◆</code></td>
      <td><code class="language-plaintext highlighter-rouge">hotspot</code></td>
      <td>1%+ self time, bursty or intermittent</td>
    </tr>
    <tr>
      <td><code class="language-plaintext highlighter-rouge">◆◆</code></td>
      <td><code class="language-plaintext highlighter-rouge">steady-hotspot</code></td>
      <td>1%+ self time, uniform across all time buckets</td>
    </tr>
  </tbody>
</table>

<p>That last category is the interesting one. A steady hotspot is a method that consumes significant CPU at a constant rate for the entire recording. It is not reacting to a spike, it is not processing a batch. It is always there, always burning. These are classic N+1 query candidates, polling loops, or inefficient serialization paths. They are the kind of thing that flamegraphs make look “normal” because they blend into the background.</p>

<h2 id="bursty-vs-steady-a-concrete-difference">Bursty vs Steady: A Concrete Difference</h2>

<p>Consider two methods that each account for 5% of total CPU in a two-minute recording:</p>

<p><strong>Method A</strong> — steady hotspot:</p>
<div class="language-plaintext highlighter-rouge"><div class="highlight"><pre class="highlight"><code>time buckets: ▃▃▃▃▃▃▃▃▃▃  (uniform across all 10 buckets)
threads:      worker-1 (40%), worker-2 (35%), worker-3 (25%)
category:     ◆◆ steady-hotspot
</code></pre></div></div>

<p>This method is always running, spread across multiple worker threads. It is a baseline cost. If you want to reduce CPU, this is a method worth optimizing because the savings compound across the entire recording.</p>

<p><strong>Method B</strong> — bursty hotspot:</p>
<div class="language-plaintext highlighter-rouge"><div class="highlight"><pre class="highlight"><code>time buckets: ▁▁▁▁▁▁▁█▁▁  (concentrated in bucket 8)
threads:      batch-processor-1 (100%)
category:     ◆ hotspot
</code></pre></div></div>

<p>Same percentage, completely different story. This method fired once, in a single burst, on a single thread. It is probably a scheduled task, a cache refresh, a one-time computation. Optimizing it would save nothing during normal operation. The right response might be to move it off the hot path or run it at a less contended time.</p>

<p>A flamegraph cannot tell these apart. <code class="language-plaintext highlighter-rouge">stackprofile</code> can, because it kept the time axis.</p>

<h2 id="flamegraph-vs-stackprofile">Flamegraph vs stackprofile</h2>

<p>The two operators complement each other. Neither replaces the other.</p>

<table>
  <thead>
    <tr>
      <th>Dimension</th>
      <th><code class="language-plaintext highlighter-rouge">flamegraph</code></th>
      <th><code class="language-plaintext highlighter-rouge">stackprofile</code></th>
    </tr>
  </thead>
  <tbody>
    <tr>
      <td>Output</td>
      <td>Aggregated call paths</td>
      <td>Call tree with temporal metadata</td>
    </tr>
    <tr>
      <td>Time axis</td>
      <td>Collapsed</td>
      <td>Preserved (bucketed)</td>
    </tr>
    <tr>
      <td>Thread info</td>
      <td>Not tracked</td>
      <td>Per-frame thread breakdown</td>
    </tr>
    <tr>
      <td>Best for</td>
      <td>“Where is CPU going?”</td>
      <td>“When and on which threads?”</td>
    </tr>
    <tr>
      <td>Pattern detection</td>
      <td>No</td>
      <td>Steady vs bursty vs intermittent</td>
    </tr>
    <tr>
      <td>Format</td>
      <td>Folded stacks or tree (visual)</td>
      <td>Structured table or JSON (analytical)</td>
    </tr>
  </tbody>
</table>

<p>Use <code class="language-plaintext highlighter-rouge">flamegraph</code> when you need to understand call paths and caller-callee relationships. Use <code class="language-plaintext highlighter-rouge">stackprofile</code> when you need to understand temporal behavior and thread affinity.</p>

<h2 id="prior-art-and-how-stackprofile-differs">Prior Art and How stackprofile Differs</h2>

<p>The idea of adding a time axis to profiling data is not new. Several tools have tried different approaches:</p>

<ul>
  <li>
    <p><strong><a href="https://www.polarsignals.com/blog/posts/2025/05/28/flamecharts-the-time-aware-sibling-of-flame-graphs">Flame Charts</a></strong> (Chrome DevTools, Polar Signals) preserve temporal ordering by not merging stacks at all. Every individual call is shown in time sequence. This is faithful to the recording, but for a two-minute JFR with tens of thousands of samples, the result is too noisy to navigate. You get time, but you lose the ability to spot patterns.</p>
  </li>
  <li>
    <p><strong><a href="https://www.brendangregg.com/flamegraphs.html">Differential Flame Graphs</a></strong> (Brendan Gregg) compare two profiles, A and B, coloring frames red or blue based on the delta. Great for before/after comparisons, but they only answer “did this method get hotter or colder between these two snapshots?” They cannot show a continuous temporal distribution within a single recording.</p>
  </li>
  <li>
    <p><strong><a href="https://blog.jetbrains.com/dotnet/2015/01/29/overview-of-dottrace-6-timeline-profiling/">dotTrace Timeline Profiling</a></strong> (JetBrains) gives a full thread-level timeline with call stacks at each point. Powerful, but .NET-only, and it is a GUI tool rather than a composable pipeline operator.</p>
  </li>
  <li>
    <p><strong><a href="https://binjr.eu/blog/2023/08/the-benefit-of-wall-clock-time-data-in-method-profiling/">binjr</a></strong> can browse JFR method profiling events as time series and show histogram density distributions. It gives you the temporal view, but it works at the individual event level rather than aggregating into a call tree.</p>
  </li>
</ul>

<p><code class="language-plaintext highlighter-rouge">stackprofile</code> takes a different path. It merges stacks like a flamegraph (keeping the output compact and navigable) but annotates every node in the tree with a bucketed time distribution and per-thread breakdown. You get the structural clarity of a merged call tree plus the temporal insight of a flame chart, without the noise of either extreme.</p>

<h2 id="for-ai-agents-too">For AI Agents Too</h2>

<p><code class="language-plaintext highlighter-rouge">stackprofile</code> is also exposed as an MCP tool (<code class="language-plaintext highlighter-rouge">jfr_stackprofile</code>) through jfr-mcp. The MCP version returns structured JSON with numeric fields for every frame: <code class="language-plaintext highlighter-rouge">totalPct</code>, <code class="language-plaintext highlighter-rouge">selfPct</code>, <code class="language-plaintext highlighter-rouge">pattern</code>, <code class="language-plaintext highlighter-rouge">category</code>, <code class="language-plaintext highlighter-rouge">timeBuckets</code> array, and <code class="language-plaintext highlighter-rouge">threadCounts</code> map. This makes it straightforward for an AI agent to programmatically identify bursty hotspots, detect N+1 patterns, or compare thread affinity across frames without parsing sparklines.</p>

<div class="language-bash highlighter-rouge"><div class="highlight"><pre class="highlight"><code>claude mcp add jafar <span class="nt">--</span> jbang jfr-mcp@btraceio <span class="nt">--stdio</span>
</code></pre></div></div>

<p>Then ask Claude to investigate temporal CPU patterns, and it will use <code class="language-plaintext highlighter-rouge">jfr_stackprofile</code> alongside <code class="language-plaintext highlighter-rouge">jfr_flamegraph</code> and <code class="language-plaintext highlighter-rouge">jfr_hotmethods</code> to build a more complete picture.</p>

<h2 id="where-it-shines">Where It Shines</h2>

<p><code class="language-plaintext highlighter-rouge">stackprofile</code> works in the plain CLI, but its full potential shows in two places: the TUI and MCP.</p>

<p>In <strong>TUI mode</strong>, the results are color-coded by category. Normal frames stay neutral, hotspots get highlighted, and steady-hotspots are immediately visible. You can jump directly to the next hotspot without scrolling through hundreds of normal frames. When a recording has thousands of frames, that navigation alone saves real time.</p>

<p><img src="/assets/images/2026-03-13-stackprofile-jfr/tui-screenshot.png" alt="stackprofile in TUI mode" /></p>

<p>Through <strong>MCP</strong>, an AI agent gets structured JSON with numeric fields it can reason over programmatically. It can scan for steady-hotspots, compare thread affinity across frames, and detect N+1 patterns without parsing visual output. The combination of <code class="language-plaintext highlighter-rouge">jfr_stackprofile</code> with <code class="language-plaintext highlighter-rouge">jfr_flamegraph</code> and <code class="language-plaintext highlighter-rouge">jfr_hotmethods</code> gives the agent three complementary views of the same CPU data.</p>

<p>The plain CLI gives you the data. The TUI makes it navigable. MCP makes it queryable by machines.</p>

<h2 id="try-it">Try It</h2>

<div class="language-bash highlighter-rouge"><div class="highlight"><pre class="highlight"><code><span class="c"># Install via JBang, open a recording</span>
jbang jfr-shell@btraceio <span class="nt">-f</span> recording.jfr <span class="nt">--tui</span>

<span class="c"># Top-down call tree with temporal bucketing</span>
jfr&gt; events/jdk.ExecutionSample | stackprofile<span class="o">()</span>

<span class="c"># Bottom-up hot methods with 20 time buckets</span>
jfr&gt; events/jdk.ExecutionSample | stackprofile<span class="o">(</span><span class="nv">direction</span><span class="o">=</span>bottom-up, <span class="nv">buckets</span><span class="o">=</span>20<span class="o">)</span>

<span class="c"># Only frames above 2% of total</span>
jfr&gt; events/jdk.ExecutionSample | stackprofile<span class="o">(</span><span class="nv">minPct</span><span class="o">=</span>2.0<span class="o">)</span>
</code></pre></div></div>

<p>The next time you find a hot method in a flamegraph, ask yourself: was it hot the entire time, or just for a moment? <code class="language-plaintext highlighter-rouge">stackprofile</code> will tell you.</p>

<hr />

<p><em>jfr-shell is part of <a href="https://github.com/btraceio/jafar">JAFAR</a> and available via <a href="https://jbang.dev">JBang</a> and <a href="https://central.sonatype.com/">Maven Central</a>.</em></p>]]></content><author><name></name></author><category term="java" /><category term="jfr" /><category term="performance" /><category term="profiling" /><category term="jfr" /><category term="jfr-shell" /><category term="stackprofile" /><category term="flamegraph" /><category term="jafar" /><category term="cpu-profiling" /><summary type="html"><![CDATA[]]></summary></entry><entry><title type="html">Let the AI Debug It: JFR Analysis Over MCP</title><link href="/posts/jfr-mcp-serve" rel="alternate" type="text/html" title="Let the AI Debug It: JFR Analysis Over MCP" /><published>2026-02-24T00:00:00+00:00</published><updated>2026-02-24T00:00:00+00:00</updated><id>/posts/jfr-mcp-serve</id><content type="html" xml:base="/posts/jfr-mcp-serve"><![CDATA[<ol id="markdown-toc">
  <li><a href="#the-pitch-you-didnt-ask-for" id="markdown-toc-the-pitch-you-didnt-ask-for">The Pitch You Didn’t Ask For</a></li>
  <li><a href="#what-mcp-actually-is-30-second-version" id="markdown-toc-what-mcp-actually-is-30-second-version">What MCP Actually Is (30-Second Version)</a></li>
  <li><a href="#jbang-zero-install-java-distribution" id="markdown-toc-jbang-zero-install-java-distribution">JBang: Zero-Install Java Distribution</a></li>
  <li><a href="#two-transports-stdio-and-http" id="markdown-toc-two-transports-stdio-and-http">Two Transports: STDIO and HTTP</a>    <ol>
      <li><a href="#stdio-mode" id="markdown-toc-stdio-mode">STDIO Mode</a></li>
      <li><a href="#httpsse-mode" id="markdown-toc-httpsse-mode">HTTP/SSE Mode</a></li>
    </ol>
  </li>
  <li><a href="#wiring-it-to-claude" id="markdown-toc-wiring-it-to-claude">Wiring It to Claude</a>    <ol>
      <li><a href="#claude-code" id="markdown-toc-claude-code">Claude Code</a></li>
      <li><a href="#claude-desktop" id="markdown-toc-claude-desktop">Claude Desktop</a></li>
      <li><a href="#building-from-source" id="markdown-toc-building-from-source">Building from Source</a></li>
    </ol>
  </li>
  <li><a href="#why-jfr-deserves-better-tooling" id="markdown-toc-why-jfr-deserves-better-tooling">Why JFR Deserves Better Tooling</a></li>
  <li><a href="#the-toolbox" id="markdown-toc-the-toolbox">The Toolbox</a>    <ol>
      <li><a href="#core-tools-opening-querying-learning" id="markdown-toc-core-tools-opening-querying-learning">Core Tools: Opening, Querying, Learning</a></li>
      <li><a href="#analysis-tools-methodologies-not-just-queries" id="markdown-toc-analysis-tools-methodologies-not-just-queries">Analysis Tools: Methodologies, Not Just Queries</a></li>
    </ol>
  </li>
  <li><a href="#what-a-conversation-looks-like" id="markdown-toc-what-a-conversation-looks-like">What a Conversation Looks Like</a></li>
  <li><a href="#the-self-teaching-trick" id="markdown-toc-the-self-teaching-trick">The Self-Teaching Trick</a></li>
  <li><a href="#use-and-tsa-standing-on-the-shoulders-of-giants" id="markdown-toc-use-and-tsa-standing-on-the-shoulders-of-giants">USE and TSA: Standing on the Shoulders of Giants</a>    <ol>
      <li><a href="#the-use-method" id="markdown-toc-the-use-method">The USE Method</a></li>
      <li><a href="#thread-state-analysis" id="markdown-toc-thread-state-analysis">Thread State Analysis</a></li>
      <li><a href="#why-this-matters-for-ai-driven-analysis" id="markdown-toc-why-this-matters-for-ai-driven-analysis">Why This Matters for AI-Driven Analysis</a></li>
    </ol>
  </li>
  <li><a href="#what-it-doesnt-do" id="markdown-toc-what-it-doesnt-do">What It Doesn’t Do</a></li>
  <li><a href="#why-not-just-use-jfr-shell-directly" id="markdown-toc-why-not-just-use-jfr-shell-directly">Why Not Just Use jfr-shell Directly?</a></li>
  <li><a href="#try-it" id="markdown-toc-try-it">Try It</a></li>
</ol>

<h2 id="the-pitch-you-didnt-ask-for">The Pitch You Didn’t Ask For</h2>

<p>A JFR recording is one of the richest artifacts a JVM can produce. CPU samples, GC pauses, memory allocations, thread states, lock contention, I/O latency, class loading, JIT compilations, exceptions — all timestamped, all in one file. The problem was never the data. The problem is that a 200MB recording from a production JVM that melted down at 3am contains <em>all of it at once</em>, and the human staring at it has to know which questions to ask, in what order, and how to connect the answers.</p>

<p>Or you could let an AI do that part.</p>

<p>Not “let an AI hallucinate a diagnosis from the filename.” Actually let it open the recording, query events, correlate thread states with lock contention, extract resource utilization metrics, run systematic performance methodologies, and explain what it found — with evidence.</p>

<p>That’s what <a href="https://github.com/jbachorik/jafar/tree/master/jfr-mcp">jfr-mcp</a> does. It’s a <a href="https://modelcontextprotocol.io/">Model Context Protocol</a> server that exposes the full depth of JFR analysis as a set of tools that any MCP-capable AI agent (Claude, for instance) can call directly. No copy-pasting terminal output. No narrowing down to a single event type and hoping it’s the right one. The AI gets the whole recording, the whole query language, and established performance analysis frameworks to work with.</p>

<h2 id="what-mcp-actually-is-30-second-version">What MCP Actually Is (30-Second Version)</h2>

<p>MCP is a protocol that lets AI agents call external tools in a structured way. The agent sees a catalog of available tools, each with a name, description, and parameter schema. When the agent decides it needs to, say, open a JFR file, it emits a tool call with the right parameters, the MCP server executes it, and the result flows back as structured data.</p>

<p>Think of it as giving the AI a CLI it can actually use, except it’s JSON over stdio instead of bash over a terminal.</p>

<h2 id="jbang-zero-install-java-distribution">JBang: Zero-Install Java Distribution</h2>

<p>Before we get into the MCP server itself, a word about how it’s distributed.</p>

<p>jfr-mcp is packaged as a fat JAR — single file, all dependencies baked in. But “download a JAR, find the right Java, set the classpath, run it” is the kind of ceremony that kills adoption. So it’s published to a <a href="https://jbang.dev">JBang</a> catalog instead.</p>

<p>JBang is a launcher that resolves, caches, and runs Java applications with zero setup. It downloads the right JDK if you don’t have one, fetches the artifact from Maven Central, caches it locally, and runs it. First invocation takes 10–30 seconds (it’s pulling ~70MB of JDK plus the JAR). Every subsequent run starts in under 2 seconds from cache.</p>

<p>If you don’t have JBang yet:</p>

<div class="language-bash highlighter-rouge"><div class="highlight"><pre class="highlight"><code><span class="c"># macOS</span>
brew <span class="nb">install </span>jbangdev/tap/jbang

<span class="c"># Linux / macOS (without Homebrew)</span>
curl <span class="nt">-Ls</span> https://sh.jbang.dev | bash <span class="nt">-s</span> - app setup

<span class="c"># Windows</span>
scoop <span class="nb">install </span>jbang
<span class="c"># or: choco install jbang</span>
<span class="c"># or: iex "&amp; { $(iwr https://ps.jbang.dev) } app setup"</span>

<span class="c"># SDKMAN (any platform)</span>
sdk <span class="nb">install </span>jbang
</code></pre></div></div>

<p>Or skip all that — the one-liner install script handles JBang installation too:</p>

<div class="language-bash highlighter-rouge"><div class="highlight"><pre class="highlight"><code>curl <span class="nt">-Ls</span> https://raw.githubusercontent.com/btraceio/jafar/main/jfr-mcp/install.sh | bash
</code></pre></div></div>

<p>This installs JBang if needed, then installs the <code class="language-plaintext highlighter-rouge">jfr-mcp</code> command. One script, no prerequisites.</p>

<p>The catalog alias is <code class="language-plaintext highlighter-rouge">jfr-mcp@btraceio</code> for stable releases and <code class="language-plaintext highlighter-rouge">jfr-mcp-dev@btraceio</code> for development snapshots. You can run directly without installing:</p>

<div class="language-bash highlighter-rouge"><div class="highlight"><pre class="highlight"><code>jbang jfr-mcp@btraceio          <span class="c"># run without installing</span>
jbang app <span class="nb">install </span>jfr-mcp@btraceio   <span class="c"># install as a command, then:</span>
jfr-mcp                              <span class="c"># run by name</span>
</code></pre></div></div>

<p>To update, force a reinstall:</p>

<div class="language-bash highlighter-rouge"><div class="highlight"><pre class="highlight"><code>jbang app <span class="nb">install</span> <span class="nt">--force</span> jfr-mcp@btraceio
</code></pre></div></div>

<p>For dev snapshots where Maven Central caching may serve stale versions:</p>

<div class="language-bash highlighter-rouge"><div class="highlight"><pre class="highlight"><code>jbang <span class="nt">--fresh</span> jfr-mcp-dev@btraceio
</code></pre></div></div>

<h2 id="two-transports-stdio-and-http">Two Transports: STDIO and HTTP</h2>

<p>The MCP server speaks two protocols. Which one you want depends on who’s talking to it.</p>

<h3 id="stdio-mode">STDIO Mode</h3>

<div class="language-bash highlighter-rouge"><div class="highlight"><pre class="highlight"><code>jfr-mcp <span class="nt">--stdio</span>
</code></pre></div></div>

<p>In STDIO mode, the server reads JSON-RPC messages from stdin and writes responses to stdout. No network port, no HTTP, no SSE. The server runs as a subprocess of whatever launched it — which is exactly how Claude Desktop and Claude Code expect to talk to MCP servers.</p>

<p>This is the mode you want for AI integration. The client (Claude) spawns the server process, sends tool calls over stdin, reads results from stdout, and kills the process when the conversation ends. Each invocation is a fresh instance. No port conflicts, no “is the server already running” questions.</p>

<h3 id="httpsse-mode">HTTP/SSE Mode</h3>

<div class="language-bash highlighter-rouge"><div class="highlight"><pre class="highlight"><code>jfr-mcp                          <span class="c"># default: port 3000</span>
jfr-mcp <span class="nt">-Dmcp</span>.port<span class="o">=</span>8080          <span class="c"># custom port</span>
</code></pre></div></div>

<p>In HTTP mode, the server starts a Jetty instance exposing two endpoints:</p>

<ul>
  <li><code class="language-plaintext highlighter-rouge">/mcp/sse</code> — Server-Sent Events stream (establishes a session)</li>
  <li><code class="language-plaintext highlighter-rouge">/mcp/message</code> — JSON-RPC message endpoint</li>
</ul>

<p>This is for web-based MCP clients, custom integrations, or manual testing with <code class="language-plaintext highlighter-rouge">curl</code>. The server auto-detects if the port is already in use and exits silently — so you won’t accidentally start two instances fighting over port 3000.</p>

<p>For most people reading this post, you want <code class="language-plaintext highlighter-rouge">--stdio</code>.</p>

<h2 id="wiring-it-to-claude">Wiring It to Claude</h2>

<h3 id="claude-code">Claude Code</h3>

<p>One command:</p>

<div class="language-bash highlighter-rouge"><div class="highlight"><pre class="highlight"><code>claude mcp add jafar <span class="nt">--</span> jbang jfr-mcp@btraceio <span class="nt">--stdio</span>
</code></pre></div></div>

<p>That registers an MCP server named <code class="language-plaintext highlighter-rouge">jafar</code> that Claude Code will start using JBang in STDIO mode. Next time you start a conversation, Claude has 13 new JFR analysis tools available. No restart needed.</p>

<h3 id="claude-desktop">Claude Desktop</h3>

<p>Edit <code class="language-plaintext highlighter-rouge">~/Library/Application Support/Claude/claude_desktop_config.json</code> (macOS) or <code class="language-plaintext highlighter-rouge">%APPDATA%\Claude\claude_desktop_config.json</code> (Windows):</p>

<div class="language-json highlighter-rouge"><div class="highlight"><pre class="highlight"><code><span class="p">{</span><span class="w">
  </span><span class="nl">"mcpServers"</span><span class="p">:</span><span class="w"> </span><span class="p">{</span><span class="w">
    </span><span class="nl">"jafar"</span><span class="p">:</span><span class="w"> </span><span class="p">{</span><span class="w">
      </span><span class="nl">"command"</span><span class="p">:</span><span class="w"> </span><span class="s2">"jbang"</span><span class="p">,</span><span class="w">
      </span><span class="nl">"args"</span><span class="p">:</span><span class="w"> </span><span class="p">[</span><span class="s2">"jfr-mcp@btraceio"</span><span class="p">,</span><span class="w"> </span><span class="s2">"--stdio"</span><span class="p">]</span><span class="w">
    </span><span class="p">}</span><span class="w">
  </span><span class="p">}</span><span class="w">
</span><span class="p">}</span><span class="w">
</span></code></pre></div></div>

<p>Restart the app. The hammer icon in the input area should now list the jfr tools.</p>

<p>For development snapshots, swap the alias:</p>

<div class="language-json highlighter-rouge"><div class="highlight"><pre class="highlight"><code><span class="p">{</span><span class="w">
  </span><span class="nl">"mcpServers"</span><span class="p">:</span><span class="w"> </span><span class="p">{</span><span class="w">
    </span><span class="nl">"jafar"</span><span class="p">:</span><span class="w"> </span><span class="p">{</span><span class="w">
      </span><span class="nl">"command"</span><span class="p">:</span><span class="w"> </span><span class="s2">"jbang"</span><span class="p">,</span><span class="w">
      </span><span class="nl">"args"</span><span class="p">:</span><span class="w"> </span><span class="p">[</span><span class="s2">"--fresh"</span><span class="p">,</span><span class="w"> </span><span class="s2">"jfr-mcp-dev@btraceio"</span><span class="p">,</span><span class="w"> </span><span class="s2">"--stdio"</span><span class="p">]</span><span class="w">
    </span><span class="p">}</span><span class="w">
  </span><span class="p">}</span><span class="w">
</span><span class="p">}</span><span class="w">
</span></code></pre></div></div>

<p>The <code class="language-plaintext highlighter-rouge">--fresh</code> flag tells JBang to bypass its cache and fetch the latest snapshot — useful when you’re testing changes that were published minutes ago.</p>

<h3 id="building-from-source">Building from Source</h3>

<p>If you prefer to skip JBang entirely:</p>

<div class="language-bash highlighter-rouge"><div class="highlight"><pre class="highlight"><code><span class="nb">cd </span>jafar
./gradlew :jfr-mcp:shadowJar
java <span class="nt">-jar</span> jfr-mcp/build/libs/jfr-mcp-<span class="k">*</span><span class="nt">-all</span>.jar <span class="nt">--stdio</span>
</code></pre></div></div>

<p>Requires Java 25+. The Claude Desktop config for a manual JAR looks like:</p>

<div class="language-json highlighter-rouge"><div class="highlight"><pre class="highlight"><code><span class="p">{</span><span class="w">
  </span><span class="nl">"mcpServers"</span><span class="p">:</span><span class="w"> </span><span class="p">{</span><span class="w">
    </span><span class="nl">"jafar"</span><span class="p">:</span><span class="w"> </span><span class="p">{</span><span class="w">
      </span><span class="nl">"command"</span><span class="p">:</span><span class="w"> </span><span class="s2">"java"</span><span class="p">,</span><span class="w">
      </span><span class="nl">"args"</span><span class="p">:</span><span class="w"> </span><span class="p">[</span><span class="s2">"-jar"</span><span class="p">,</span><span class="w"> </span><span class="s2">"/path/to/jfr-mcp-0.15.0-all.jar"</span><span class="p">,</span><span class="w"> </span><span class="s2">"--stdio"</span><span class="p">]</span><span class="w">
    </span><span class="p">}</span><span class="w">
  </span><span class="p">}</span><span class="w">
</span><span class="p">}</span><span class="w">
</span></code></pre></div></div>

<h2 id="why-jfr-deserves-better-tooling">Why JFR Deserves Better Tooling</h2>

<p>Most people who touch JFR recordings end up tunneling in on one event type. Open the file, look at CPU samples, maybe check GC pauses, close the file. That’s like reading the first chapter of a detective novel and declaring the butler did it.</p>

<p>A JFR recording is a correlated, timestamped snapshot of <em>everything the JVM was doing</em>. CPU and native method samples. GC phases and heap summaries. Thread lifecycle events. Monitor contention. File and socket I/O. Object allocations. Class loading. JIT compilation phases. Exception throws. And the power of JFR is that all of these events share a timeline — you can correlate a GC pause with the thread states that were blocked during it, or trace an allocation spike to the exact call path that triggered it.</p>

<p>The MCP server is designed to treat the recording holistically. It doesn’t just expose “query this event type.” It exposes systematic analysis frameworks that cross-cut multiple event types and produce a coherent picture.</p>

<h2 id="the-toolbox">The Toolbox</h2>

<p>The server exposes 13 tools organized in two layers.</p>

<h3 id="core-tools-opening-querying-learning">Core Tools: Opening, Querying, Learning</h3>

<table>
  <thead>
    <tr>
      <th>Tool</th>
      <th>What it does</th>
    </tr>
  </thead>
  <tbody>
    <tr>
      <td><code class="language-plaintext highlighter-rouge">jfr_open</code></td>
      <td>Opens a recording. Returns session ID, event count, timestamp range.</td>
    </tr>
    <tr>
      <td><code class="language-plaintext highlighter-rouge">jfr_close</code></td>
      <td>Closes a session (or all sessions).</td>
    </tr>
    <tr>
      <td><code class="language-plaintext highlighter-rouge">jfr_list_types</code></td>
      <td>Lists event types present in the recording. Optional scan for actual counts.</td>
    </tr>
    <tr>
      <td><code class="language-plaintext highlighter-rouge">jfr_query</code></td>
      <td>Runs a JfrPath query against any event type. The surgical instrument.</td>
    </tr>
    <tr>
      <td><code class="language-plaintext highlighter-rouge">jfr_help</code></td>
      <td>Returns JfrPath documentation so the AI can learn the query language on the fly.</td>
    </tr>
  </tbody>
</table>

<p><code class="language-plaintext highlighter-rouge">jfr_query</code> accepts the same JfrPath expressions that <a href="https://github.com/jbachorik/jafar">jfr-shell</a> uses:</p>

<div class="language-plaintext highlighter-rouge"><div class="highlight"><pre class="highlight"><code>events/jdk.ExecutionSample | groupBy(eventThread.javaName) | top(10)
events/jdk.GCPhasePause | count()
events/jdk.FileRead[bytes&gt;1000] | groupBy(path)
</code></pre></div></div>

<p>The AI doesn’t need to know JfrPath in advance. It calls <code class="language-plaintext highlighter-rouge">jfr_help</code> first, reads the syntax reference, and constructs queries from there. This is one of those details that sounds minor but matters a lot in practice — the agent is self-teaching, not hardcoded.</p>

<h3 id="analysis-tools-methodologies-not-just-queries">Analysis Tools: Methodologies, Not Just Queries</h3>

<p>This is where the holistic approach lives. These tools don’t just run a single query — they correlate across event types and apply structured analysis frameworks.</p>

<table>
  <thead>
    <tr>
      <th>Tool</th>
      <th>What it does</th>
    </tr>
  </thead>
  <tbody>
    <tr>
      <td><code class="language-plaintext highlighter-rouge">jfr_summary</code></td>
      <td>Recording overview: duration, event counts, GC stats, CPU sampling density, exception patterns. The table of contents.</td>
    </tr>
    <tr>
      <td><code class="language-plaintext highlighter-rouge">jfr_use</code></td>
      <td><a href="https://www.brendangregg.com/usemethod.html">USE Method</a> analysis: Utilization, Saturation, Errors across CPU, memory, threads, and I/O.</td>
    </tr>
    <tr>
      <td><code class="language-plaintext highlighter-rouge">jfr_tsa</code></td>
      <td><a href="https://www.brendangregg.com/tsamethod.html">Thread State Analysis</a>: how threads distribute across RUNNABLE, WAITING, BLOCKED, with lock correlation.</td>
    </tr>
    <tr>
      <td><code class="language-plaintext highlighter-rouge">jfr_diagnose</code></td>
      <td>Automated triage. Inspects the recording and triggers the right analyses based on what it finds.</td>
    </tr>
    <tr>
      <td><code class="language-plaintext highlighter-rouge">jfr_hotmethods</code></td>
      <td>CPU-intensive method ranking from leaf frames.</td>
    </tr>
    <tr>
      <td><code class="language-plaintext highlighter-rouge">jfr_flamegraph</code></td>
      <td>Aggregated stack traces in folded or tree format. Top-down or bottom-up.</td>
    </tr>
    <tr>
      <td><code class="language-plaintext highlighter-rouge">jfr_callgraph</code></td>
      <td>Caller-callee relationship graph. DOT or JSON.</td>
    </tr>
    <tr>
      <td><code class="language-plaintext highlighter-rouge">jfr_exceptions</code></td>
      <td>Exception grouping by type, throw site, and frequency.</td>
    </tr>
  </tbody>
</table>

<p><code class="language-plaintext highlighter-rouge">jfr_diagnose</code> is the entry point for the “I don’t know what’s wrong” case. The server inspects the recording — is there high exception volume? GC pressure? CPU saturation? Thread contention? — and runs the relevant analyses automatically, composing <code class="language-plaintext highlighter-rouge">jfr_use</code>, <code class="language-plaintext highlighter-rouge">jfr_tsa</code>, and other tools as needed. It’s the tool an AI reaches for first when you say “something is slow and I don’t know why.”</p>

<h2 id="what-a-conversation-looks-like">What a Conversation Looks Like</h2>

<p>Here’s a realistic exchange. You drop a JFR file in front of Claude and ask what’s wrong:</p>

<blockquote>
  <p><strong>You:</strong> Open <code class="language-plaintext highlighter-rouge">/tmp/checkout-service.jfr</code> and tell me why latency spiked.</p>
</blockquote>

<p>Behind the scenes, Claude works through the recording methodically:</p>

<ol>
  <li><strong><code class="language-plaintext highlighter-rouge">jfr_open</code></strong> — opens the recording, gets session ID and timestamp range</li>
  <li><strong><code class="language-plaintext highlighter-rouge">jfr_use</code></strong> — runs USE Method analysis. CPU utilization is 92%, thread saturation is high (long monitor waits), memory shows frequent GC pauses. Now it knows <em>which resources</em> are stressed.</li>
  <li><strong><code class="language-plaintext highlighter-rouge">jfr_tsa</code></strong> — runs Thread State Analysis. 40% of checkout-handler threads are BLOCKED, not RUNNABLE. The bottleneck isn’t just CPU — threads are waiting on something. TSA correlates this with <code class="language-plaintext highlighter-rouge">jdk.JavaMonitorEnter</code> events and identifies <code class="language-plaintext highlighter-rouge">InventoryCache.lock</code> as the contention point.</li>
  <li><strong><code class="language-plaintext highlighter-rouge">jfr_hotmethods</code></strong> — of the threads that <em>are</em> running, <code class="language-plaintext highlighter-rouge">com.example.cart.PriceCalculator.recomputeTotals</code> dominates CPU samples</li>
  <li><strong><code class="language-plaintext highlighter-rouge">jfr_query</code></strong> — targeted follow-up: <code class="language-plaintext highlighter-rouge">events/jdk.JavaMonitorEnter[monitorClass='InventoryCache'] | top(5, by=duration)</code> confirms the lock is held for 200ms+ during cache refresh</li>
</ol>

<p>Claude then synthesizes: USE analysis shows CPU saturation and thread contention. TSA identifies that checkout threads spend 40% of their time BLOCKED on <code class="language-plaintext highlighter-rouge">InventoryCache.lock</code>. The lock holder is <code class="language-plaintext highlighter-rouge">PriceCalculator.recomputeTotals</code>, which is also the CPU hotspot. The latency spike correlates with cache refresh intervals. Recommendation: decouple the cache refresh from the read path.</p>

<p>Notice the structure: USE first to identify <em>which</em> resources are stressed, TSA to understand <em>how</em> threads are affected, then targeted queries to confirm the specific mechanism. Each finding cross-references a different slice of the same recording. That’s the holistic approach — not “look at CPU samples” but “systematically check every resource class, then drill into the ones that hurt.”</p>

<h2 id="the-self-teaching-trick">The Self-Teaching Trick</h2>

<p>When you first connect the MCP server, the AI has never seen JfrPath. It doesn’t need to have. The conversation typically goes:</p>

<ol>
  <li>AI calls <code class="language-plaintext highlighter-rouge">jfr_help</code> with topic <code class="language-plaintext highlighter-rouge">overview</code></li>
  <li>Reads the syntax reference (event paths, filters, pipeline operators, aggregation functions)</li>
  <li>Starts constructing queries</li>
</ol>

<p>This is possible because <code class="language-plaintext highlighter-rouge">jfr_help</code> returns comprehensive documentation broken into topics: <code class="language-plaintext highlighter-rouge">overview</code>, <code class="language-plaintext highlighter-rouge">filters</code>, <code class="language-plaintext highlighter-rouge">pipeline</code>, <code class="language-plaintext highlighter-rouge">functions</code>, <code class="language-plaintext highlighter-rouge">examples</code>, <code class="language-plaintext highlighter-rouge">event_types</code>. The AI reads what it needs, when it needs it.</p>

<p>It won’t always write a perfect query on the first try. But the error messages from <code class="language-plaintext highlighter-rouge">jfr_query</code> are informative enough that the AI can self-correct — adjust a field name, fix a filter syntax, try a different aggregation. It’s the same loop a human goes through, just compressed into a few hundred milliseconds of API calls.</p>

<h2 id="use-and-tsa-standing-on-the-shoulders-of-giants">USE and TSA: Standing on the Shoulders of Giants</h2>

<p>The most important design decision in jfr-mcp is not which JFR events it can parse. It’s that the analysis tools implement <em>real performance engineering methodologies</em> rather than ad-hoc “let me grep for big numbers.”</p>

<h3 id="the-use-method">The USE Method</h3>

<p>Brendan Gregg’s <a href="https://www.brendangregg.com/usemethod.html">USE Method</a> is a systematic approach to resource analysis: for every resource in the system, check three things — <strong>U</strong>tilization, <strong>S</strong>aturation, and <strong>E</strong>rrors. It’s simple, exhaustive, and it prevents the common trap of fixating on one metric while ignoring the actual bottleneck.</p>

<p><code class="language-plaintext highlighter-rouge">jfr_use</code> applies this to four resource classes extracted from the JFR recording:</p>

<table>
  <thead>
    <tr>
      <th>Resource</th>
      <th>Utilization</th>
      <th>Saturation</th>
      <th>Errors</th>
    </tr>
  </thead>
  <tbody>
    <tr>
      <td><strong>CPU</strong></td>
      <td><code class="language-plaintext highlighter-rouge">jdk.CPULoad</code>, <code class="language-plaintext highlighter-rouge">jdk.ThreadCPULoad</code></td>
      <td>Run queue depth</td>
      <td>—</td>
    </tr>
    <tr>
      <td><strong>Memory</strong></td>
      <td>Heap usage from <code class="language-plaintext highlighter-rouge">jdk.GCHeapSummary</code></td>
      <td>GC pause frequency and duration</td>
      <td>Allocation failures</td>
    </tr>
    <tr>
      <td><strong>Threads/Locks</strong></td>
      <td>Active thread count</td>
      <td><code class="language-plaintext highlighter-rouge">jdk.JavaMonitorEnter</code> wait times, <code class="language-plaintext highlighter-rouge">jdk.ThreadPark</code> durations</td>
      <td>—</td>
    </tr>
    <tr>
      <td><strong>I/O</strong></td>
      <td><code class="language-plaintext highlighter-rouge">jdk.FileRead</code>, <code class="language-plaintext highlighter-rouge">jdk.FileWrite</code>, <code class="language-plaintext highlighter-rouge">jdk.SocketRead</code>, <code class="language-plaintext highlighter-rouge">jdk.SocketWrite</code> throughput</td>
      <td>I/O wait times</td>
      <td>I/O errors</td>
    </tr>
  </tbody>
</table>

<p>A single <code class="language-plaintext highlighter-rouge">jfr_use</code> call cross-references all of these event types and returns a structured report with actionable insights. When an AI runs this as a first step, it immediately knows which resource classes are healthy and which need investigation — before looking at a single stack trace.</p>

<h3 id="thread-state-analysis">Thread State Analysis</h3>

<p>Gregg’s <a href="https://www.brendangregg.com/tsamethod.html">TSA Method</a> asks a different question: instead of “which resource is stressed,” it asks “what are threads actually <em>doing</em> with their time?” A thread is either running on-CPU, waiting for I/O, waiting for a lock, sleeping, or parked. The distribution across these states tells you whether your application is CPU-bound, I/O-bound, lock-bound, or just idle.</p>

<p><code class="language-plaintext highlighter-rouge">jfr_tsa</code> groups execution samples by thread state — RUNNABLE, WAITING, TIMED_WAITING, BLOCKED — and breaks down the distribution globally and per-thread. When it finds threads spending significant time in BLOCKED state, it correlates with <code class="language-plaintext highlighter-rouge">jdk.JavaMonitorEnter</code> and <code class="language-plaintext highlighter-rouge">jdk.JavaMonitorWait</code> events to identify <em>which locks</em> are responsible and <em>who is holding them</em>.</p>

<p>This is the kind of analysis that, done manually, requires querying three or four different event types and cross-referencing timestamps. The MCP server does it in one call and returns structured results the AI can reason about.</p>

<h3 id="why-this-matters-for-ai-driven-analysis">Why This Matters for AI-Driven Analysis</h3>

<p>An AI without methodology is a pattern matcher looking for big numbers. An AI <em>with</em> methodology has a playbook: run USE to classify resource bottlenecks, run TSA to understand thread behavior, then drill into the specific event types that USE and TSA flagged. <code class="language-plaintext highlighter-rouge">jfr_diagnose</code> orchestrates exactly this — it inspects the recording characteristics, runs the appropriate methodologies, and chains into targeted follow-ups based on what it finds.</p>

<p>The AI doesn’t need to be an expert in JFR event types. It needs to follow a framework that an expert designed. The frameworks are baked into the tools.</p>

<h2 id="what-it-doesnt-do">What It Doesn’t Do</h2>

<p>A few things to be upfront about:</p>

<ul>
  <li><strong>No live attach.</strong> The MCP server works with recorded <code class="language-plaintext highlighter-rouge">.jfr</code> files, not live JVMs. You still need to capture the recording first (<code class="language-plaintext highlighter-rouge">jcmd</code>, JDK Mission Control, or continuous profiling infrastructure).</li>
  <li><strong>No visualization.</strong> Results come back as structured data and text, not rendered charts. The AI can read and reason about them; if you want a flamegraph SVG, pipe the folded output from <code class="language-plaintext highlighter-rouge">jfr_flamegraph</code> into your favorite renderer.</li>
  <li><strong>The AI can be wrong.</strong> It’s working with real data and real methodologies, but its interpretations are still AI-generated. Treat them as a knowledgeable colleague’s first take, not as gospel. The difference is that every claim is backed by a query you can re-run yourself.</li>
</ul>

<h2 id="why-not-just-use-jfr-shell-directly">Why Not Just Use jfr-shell Directly?</h2>

<p>Good question. If you know JfrPath well and have a hypothesis to test, jfr-shell (especially with the <a href="/posts/jfr-shell-tui">TUI</a>) is probably faster. You know what you’re looking for, you write the query, you get the answer.</p>

<p>The MCP server shines when:</p>

<ul>
  <li><strong>You don’t know where to start.</strong> The AI can run <code class="language-plaintext highlighter-rouge">jfr_diagnose</code>, form hypotheses, and chase leads without you directing every step.</li>
  <li><strong>You want a summary for someone else.</strong> Ask the AI to write up findings. It’ll produce a narrative backed by USE/TSA data, which is more useful in a Slack thread than a raw query dump.</li>
  <li><strong>You’re reviewing multiple recordings.</strong> Open three recordings from different services, ask the AI to compare thread behavior across them. It’ll manage the sessions and cross-reference results.</li>
  <li><strong>You’re tired.</strong> It’s 3am, the pager went off, and you need to triage fast. Let the AI do the first pass while you get coffee.</li>
</ul>

<p>jfr-shell gives you precision. The MCP server gives you leverage. They’re not competing — jfr-mcp uses the same parser, the same query engine, and the same analysis primitives under the hood.</p>

<h2 id="try-it">Try It</h2>

<div class="language-bash highlighter-rouge"><div class="highlight"><pre class="highlight"><code><span class="c"># One-liner: installs JBang (if needed) + jfr-mcp</span>
curl <span class="nt">-Ls</span> https://raw.githubusercontent.com/btraceio/jafar/main/jfr-mcp/install.sh | bash

<span class="c"># Or manually via JBang</span>
jbang app <span class="nb">install </span>jfr-mcp@btraceio

<span class="c"># Wire it to Claude Code</span>
claude mcp add jafar <span class="nt">--</span> jbang jfr-mcp@btraceio <span class="nt">--stdio</span>

<span class="c"># Then in any conversation:</span>
<span class="c"># "Open /path/to/recording.jfr and diagnose the performance issue"</span>
</code></pre></div></div>

<hr />

<p><em>jfr-mcp is part of <a href="https://github.com/jbachorik/jafar">JAFAR</a> and available via <a href="https://jbang.dev">JBang</a> and <a href="https://central.sonatype.com/">Maven Central</a>. Source on <a href="https://github.com/jbachorik/jafar/tree/master/jfr-mcp">GitHub</a>.</em></p>]]></content><author><name></name></author><category term="java" /><category term="jfr" /><category term="mcp" /><category term="performance" /><category term="jfr" /><category term="jfr-mcp" /><category term="mcp" /><category term="claude" /><category term="ai" /><category term="profiling" /><category term="jafar" /><summary type="html"><![CDATA[]]></summary></entry><entry><title type="html">JFR Shell Gets a TUI: Because Scrolling Is for Mortals</title><link href="/posts/jfr-shell-tui" rel="alternate" type="text/html" title="JFR Shell Gets a TUI: Because Scrolling Is for Mortals" /><published>2026-02-23T00:00:00+00:00</published><updated>2026-02-23T00:00:00+00:00</updated><id>/posts/jfr-shell-tui</id><content type="html" xml:base="/posts/jfr-shell-tui"><![CDATA[<ol id="markdown-toc">
  <li><a href="#the-problem-with-scrolling" id="markdown-toc-the-problem-with-scrolling">The Problem with Scrolling</a></li>
  <li><a href="#getting-in" id="markdown-toc-getting-in">Getting In</a></li>
  <li><a href="#the-layout" id="markdown-toc-the-layout">The Layout</a></li>
  <li><a href="#tabs" id="markdown-toc-tabs">Tabs</a></li>
  <li><a href="#search-and-filter" id="markdown-toc-search-and-filter">Search and Filter</a></li>
  <li><a href="#sorting" id="markdown-toc-sorting">Sorting</a></li>
  <li><a href="#the-detail-pane" id="markdown-toc-the-detail-pane">The Detail Pane</a></li>
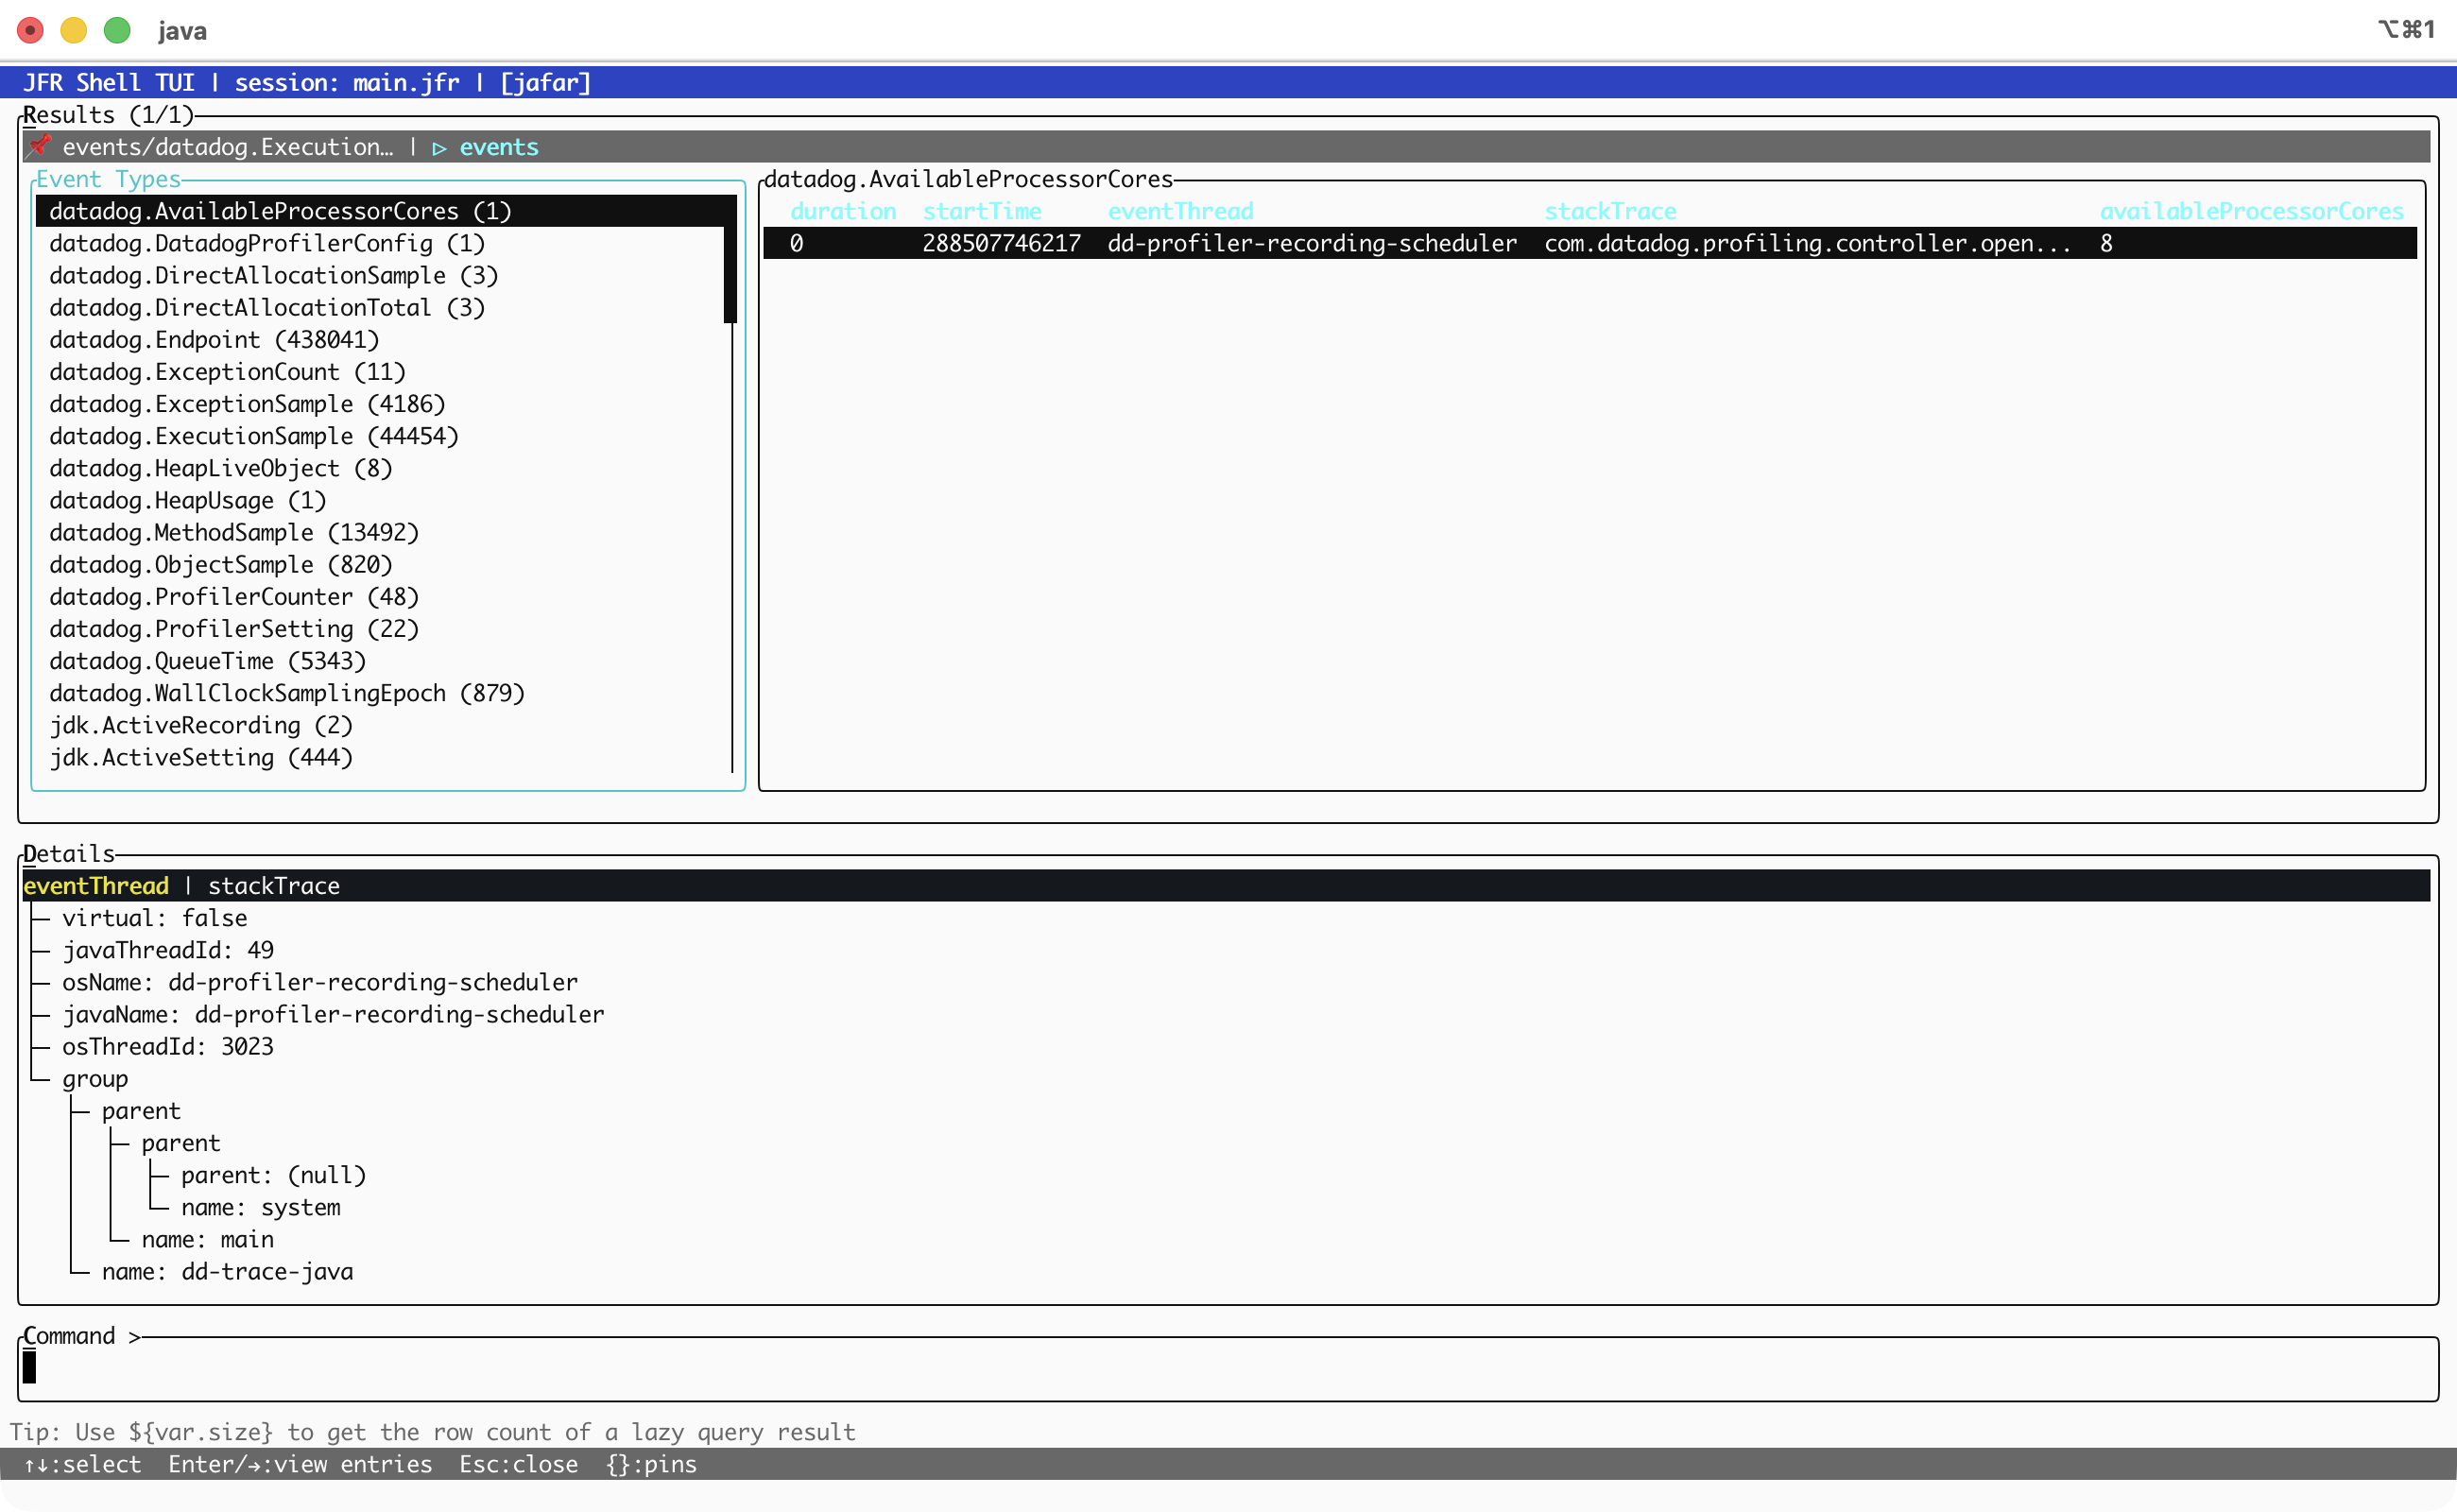
  <li><a href="#event-browser" id="markdown-toc-event-browser">Event Browser</a></li>
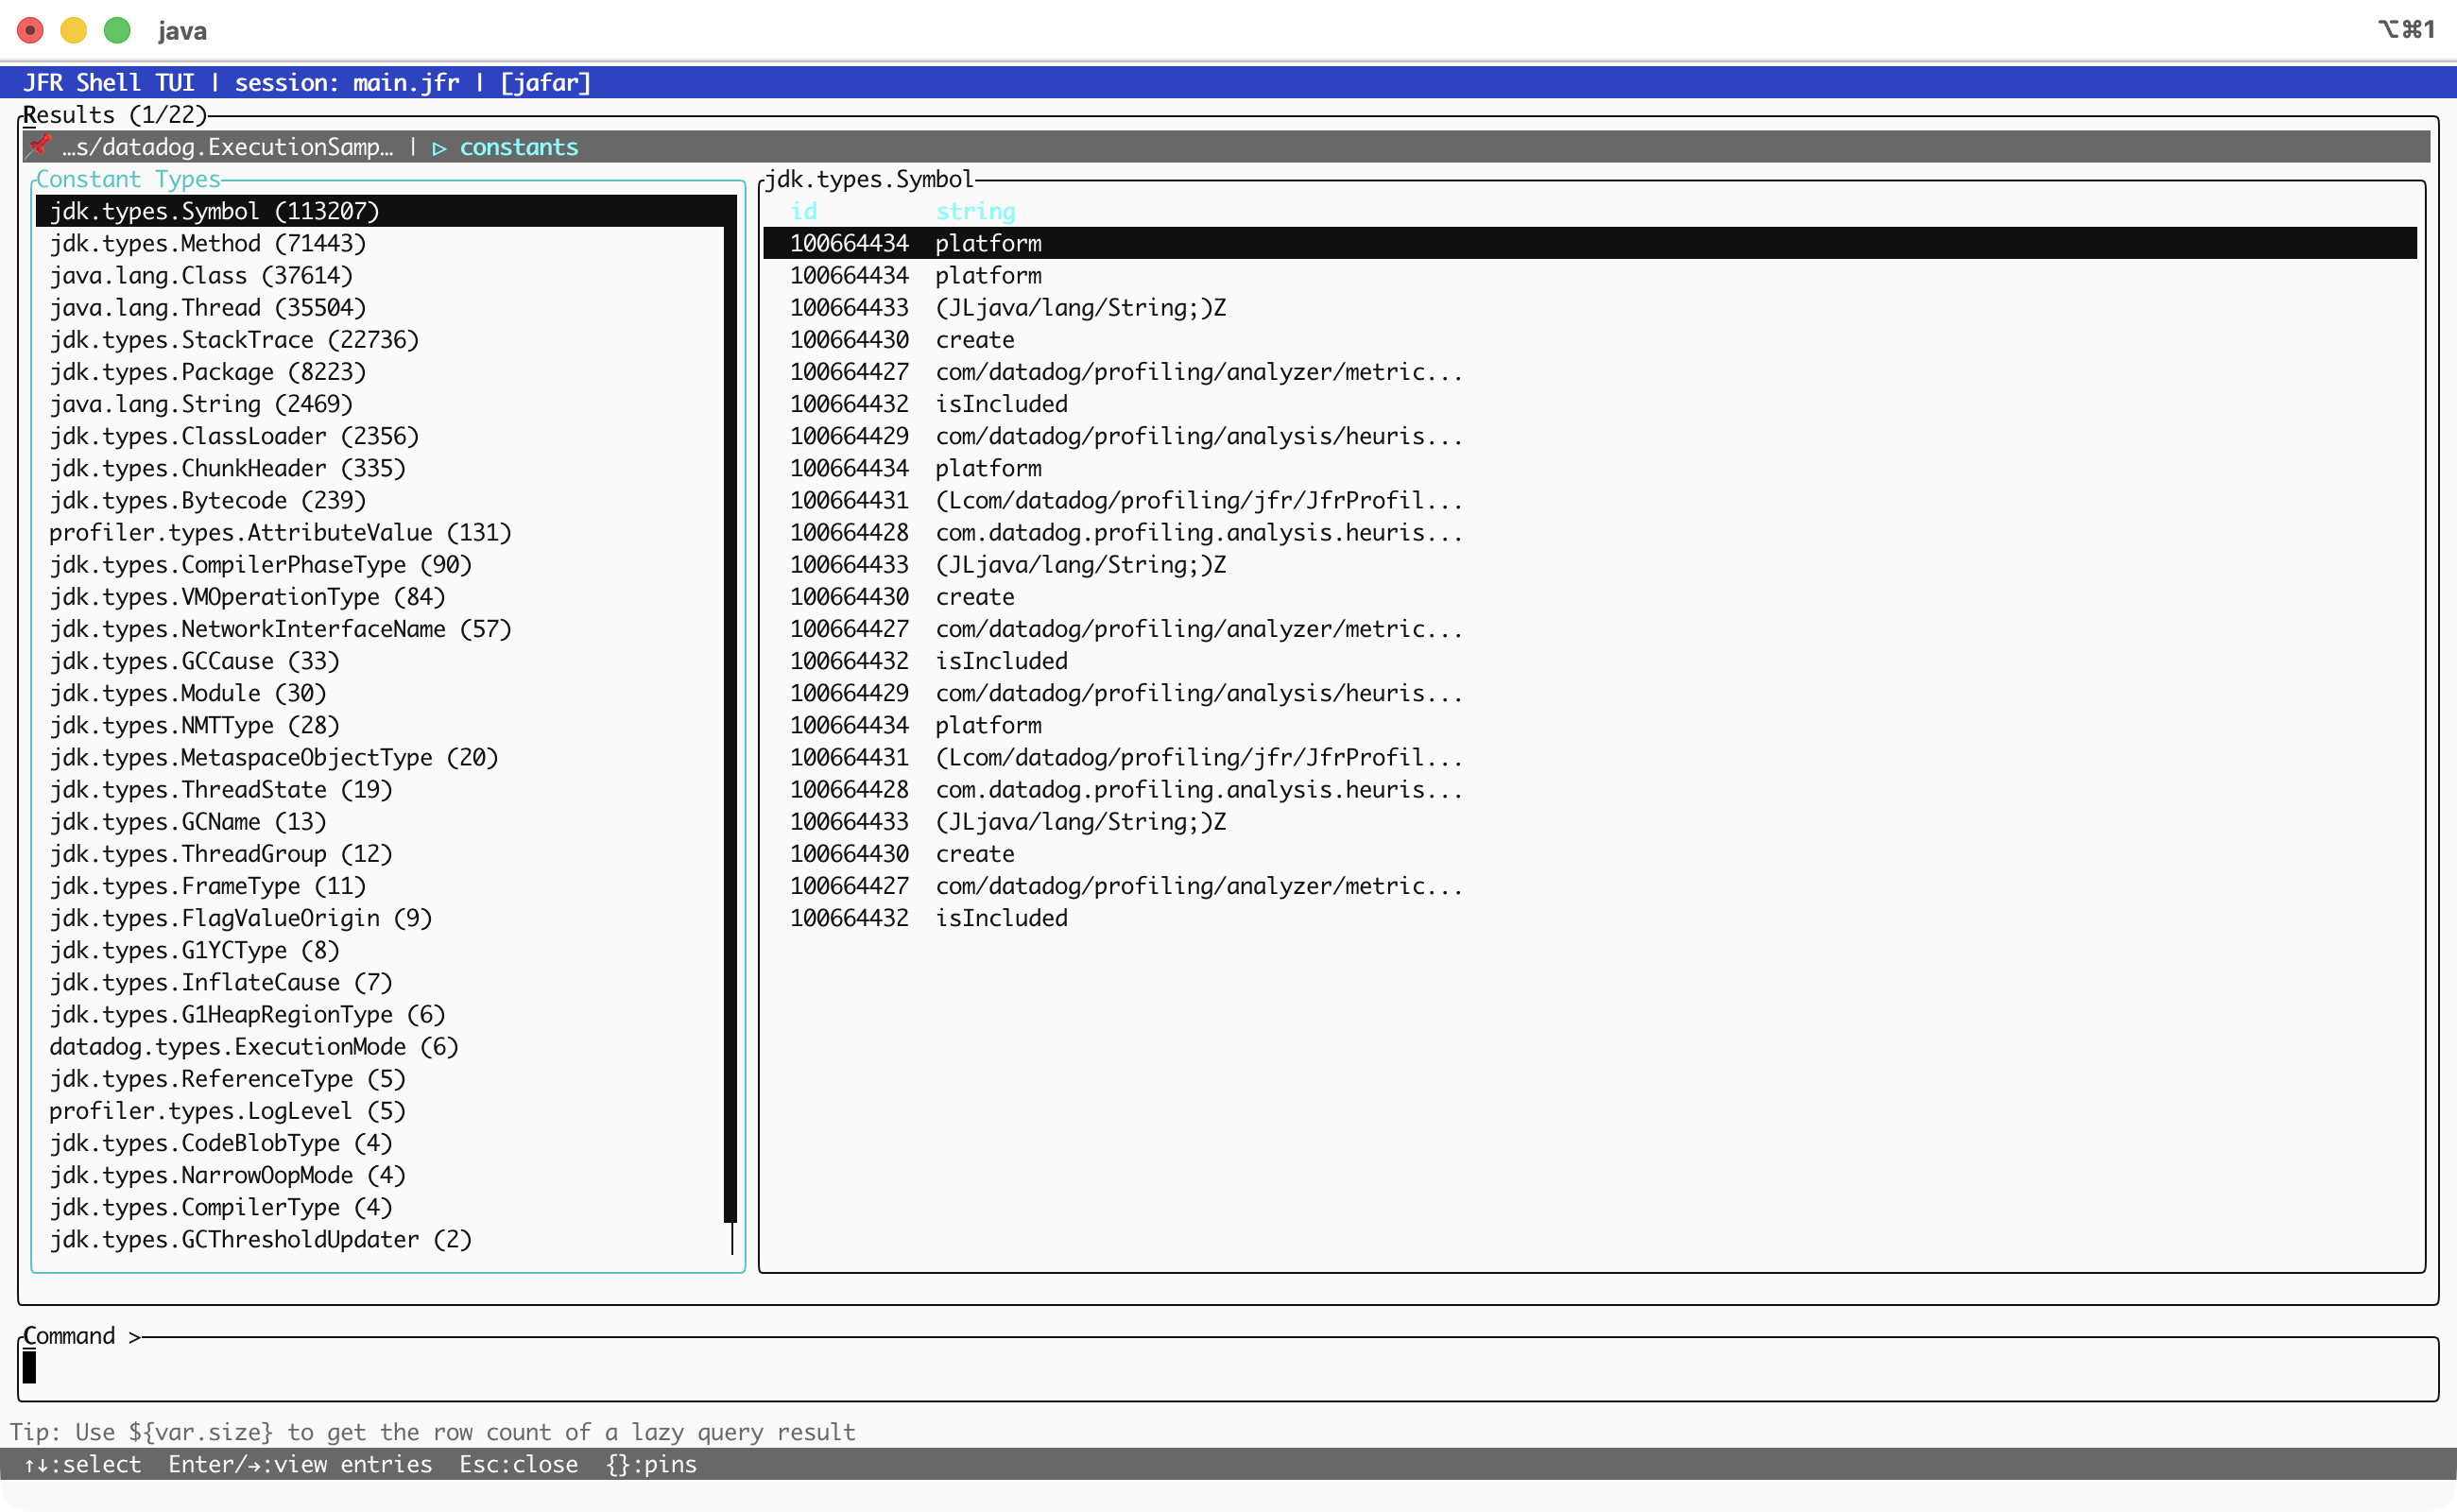
  <li><a href="#constant-pool-browser" id="markdown-toc-constant-pool-browser">Constant Pool Browser</a></li>
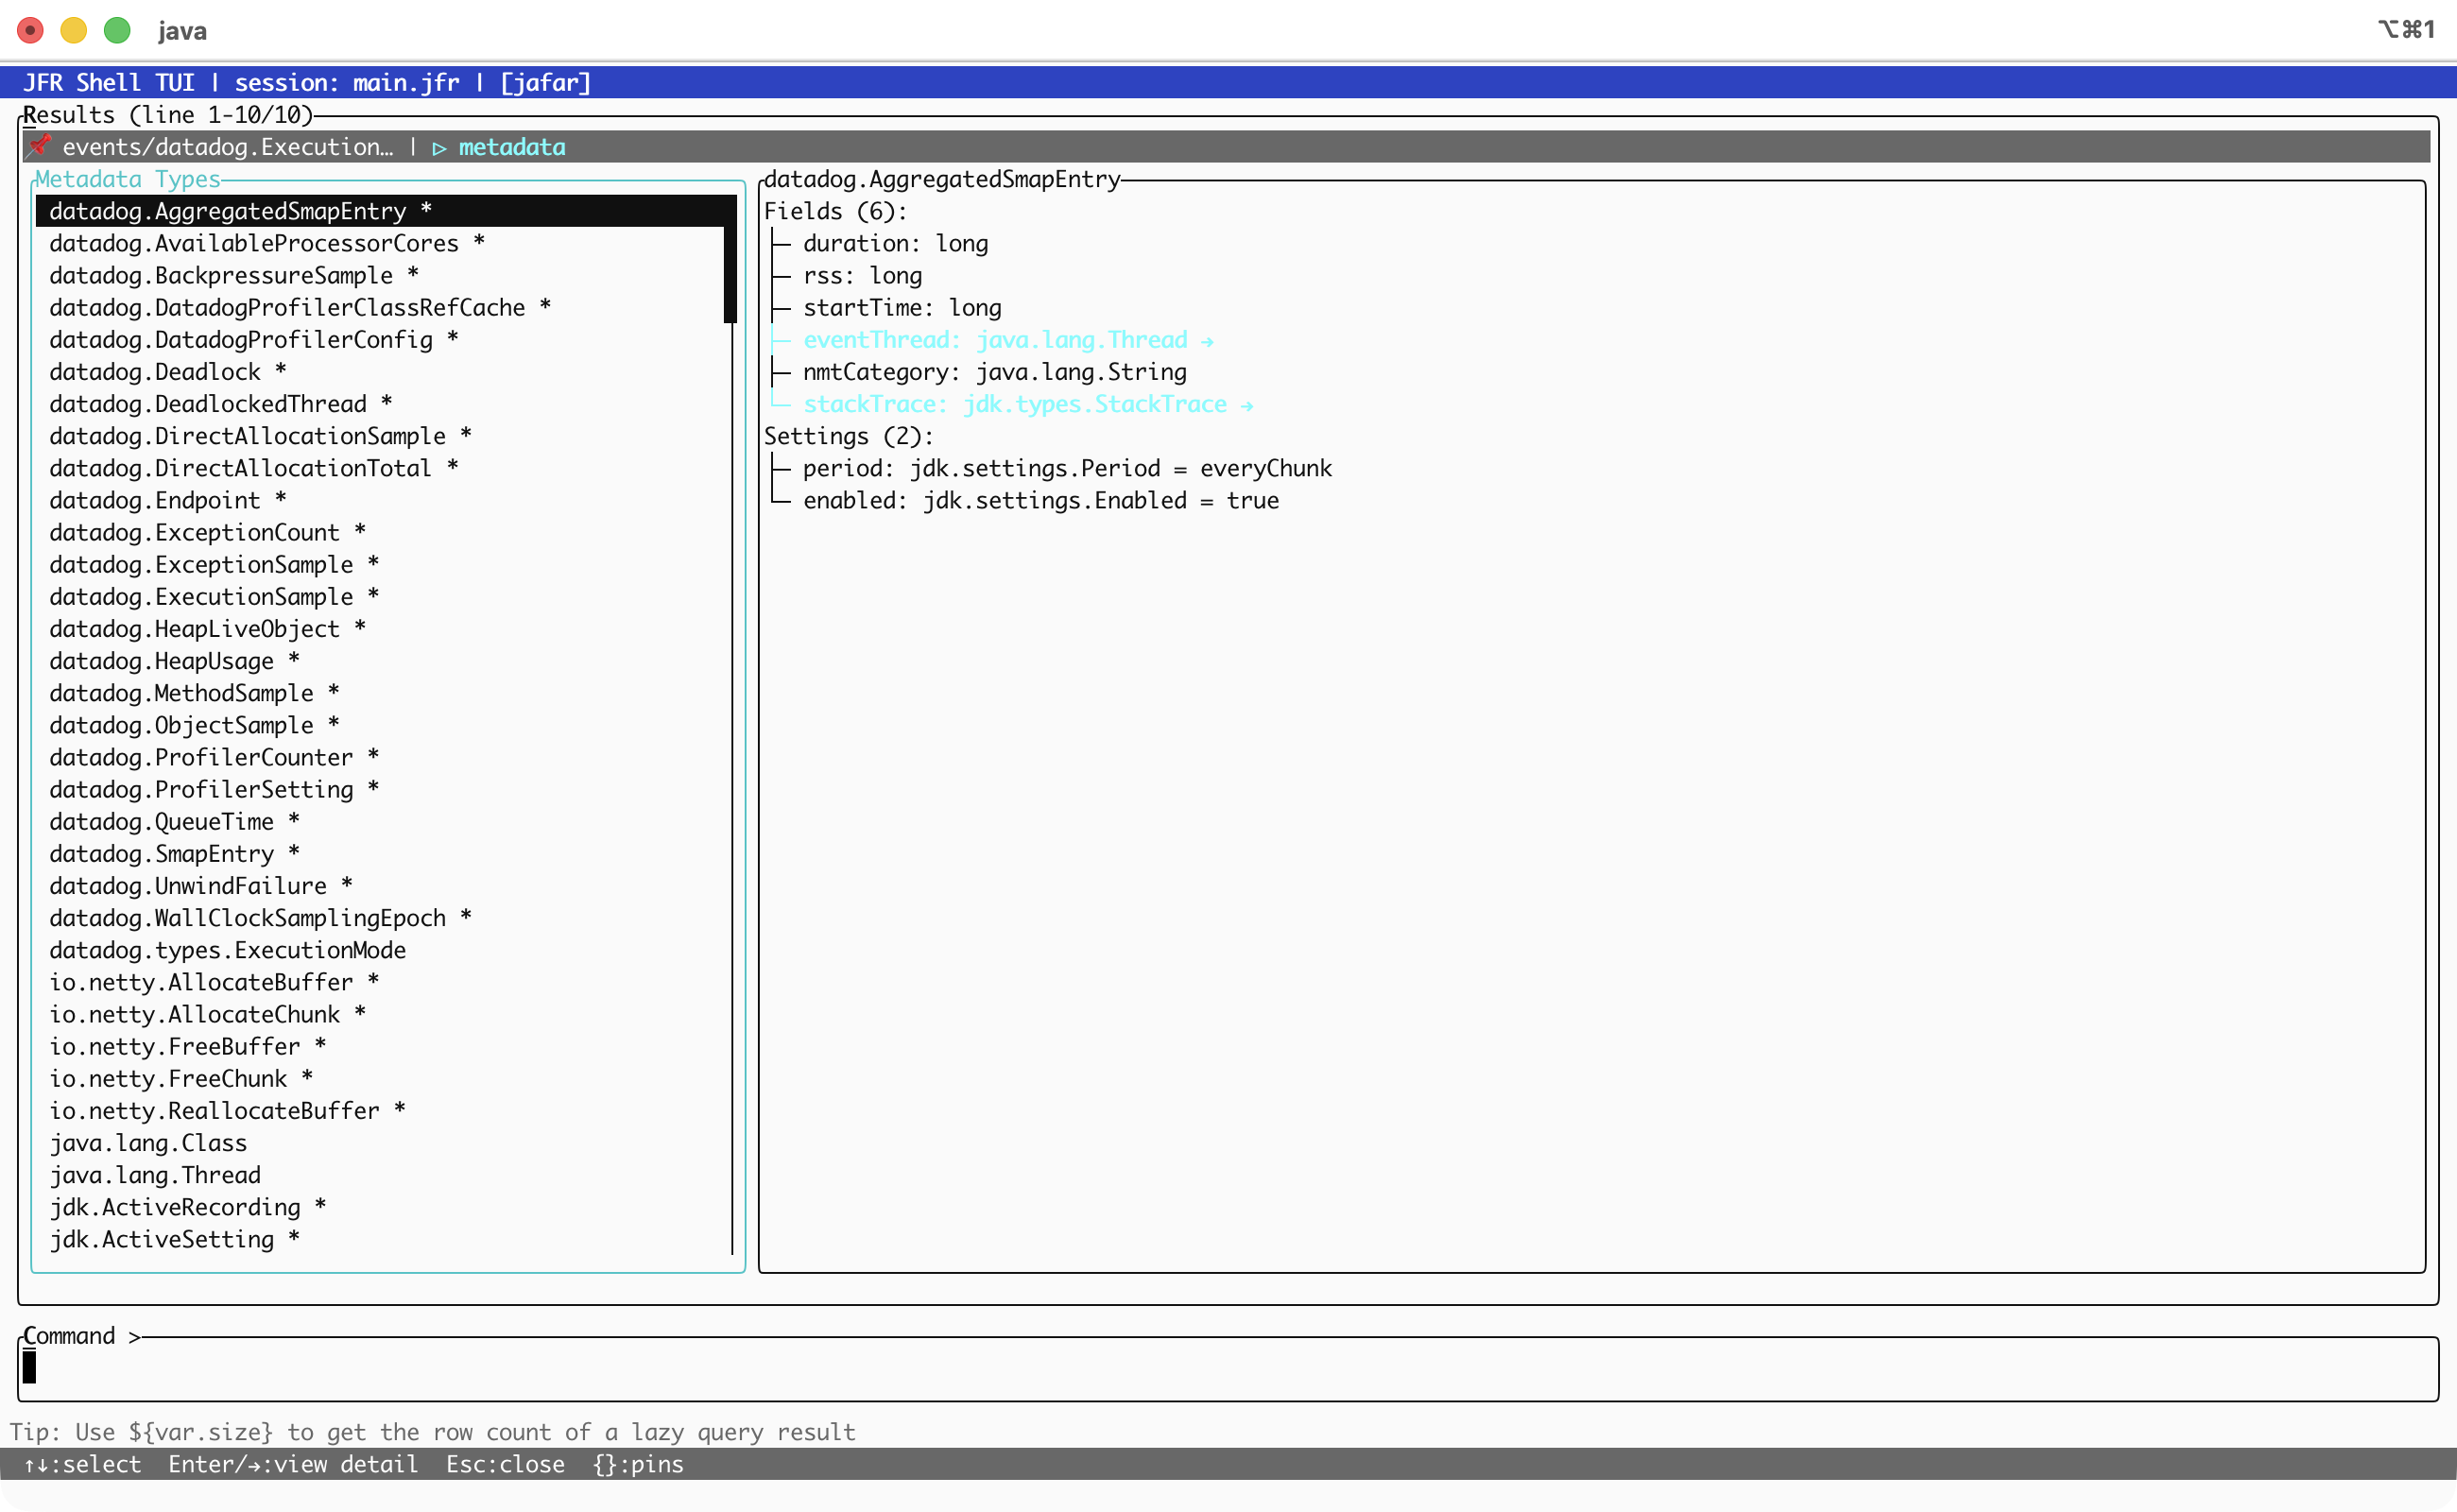
  <li><a href="#metadata" id="markdown-toc-metadata">Metadata</a></li>
  <li><a href="#session-switching" id="markdown-toc-session-switching">Session Switching</a></li>
  <li><a href="#completion" id="markdown-toc-completion">Completion</a></li>
  <li><a href="#export" id="markdown-toc-export">Export</a></li>
  <li><a href="#history" id="markdown-toc-history">History</a></li>
  <li><a href="#cell-picker" id="markdown-toc-cell-picker">Cell Picker</a></li>
  <li><a href="#the-keyboard-cheat-sheet" id="markdown-toc-the-keyboard-cheat-sheet">The Keyboard Cheat Sheet</a></li>
  <li><a href="#under-the-hood" id="markdown-toc-under-the-hood">Under the Hood</a></li>
  <li><a href="#try-it" id="markdown-toc-try-it">Try It</a></li>
</ol>

<h2 id="the-problem-with-scrolling">The Problem with Scrolling</h2>

<p>If you have used <a href="https://github.com/jbachorik/jafar">jfr-shell</a> for any non-trivial analysis, you know the drill. You run a query, get a wall of text, scroll up to see the header, lose your place, scroll back down, squint at a column that wrapped awkwardly, then run the query again with <code class="language-plaintext highlighter-rouge">--limit 10</code> because your terminal buffer just swallowed the first thousand rows.</p>

<p>It works. It’s fine. It’s also the terminal equivalent of reading a spreadsheet by printing it on a receipt roll.</p>

<p>Starting with version <strong>0.14.0</strong>, jfr-shell ships with a full-screen terminal UI mode built on <a href="https://github.com/jbachorik/tamboui">TamboUI</a>, a ratatui-inspired widget framework for Java. Launch it with <code class="language-plaintext highlighter-rouge">--tui</code> and the scrolling stops. Everything stays put. You navigate, filter, drill down, and export - all without losing context.</p>

<h2 id="getting-in">Getting In</h2>

<div class="language-bash highlighter-rouge"><div class="highlight"><pre class="highlight"><code>jfr-shell <span class="nt">--tui</span>
jfr&gt; open recording.jfr
</code></pre></div></div>

<p>That’s it. Launch the TUI, open a recording. Same queries, same JfrPath, same everything. The difference is that the output no longer scrolls off into the void.</p>

<!-- SCREENSHOT: tui-overview.png
     Capture: Launch jfr-shell --tui, then open a recording.
     Run a query like: events/datadog.ExecutionSample | groupBy(eventThread.javaName)
     Show the full TUI layout: status bar at top, table results in the middle,
     command input at the bottom, tips line and hints bar visible.
     Terminal should be at least 120x40 for a good shot. -->
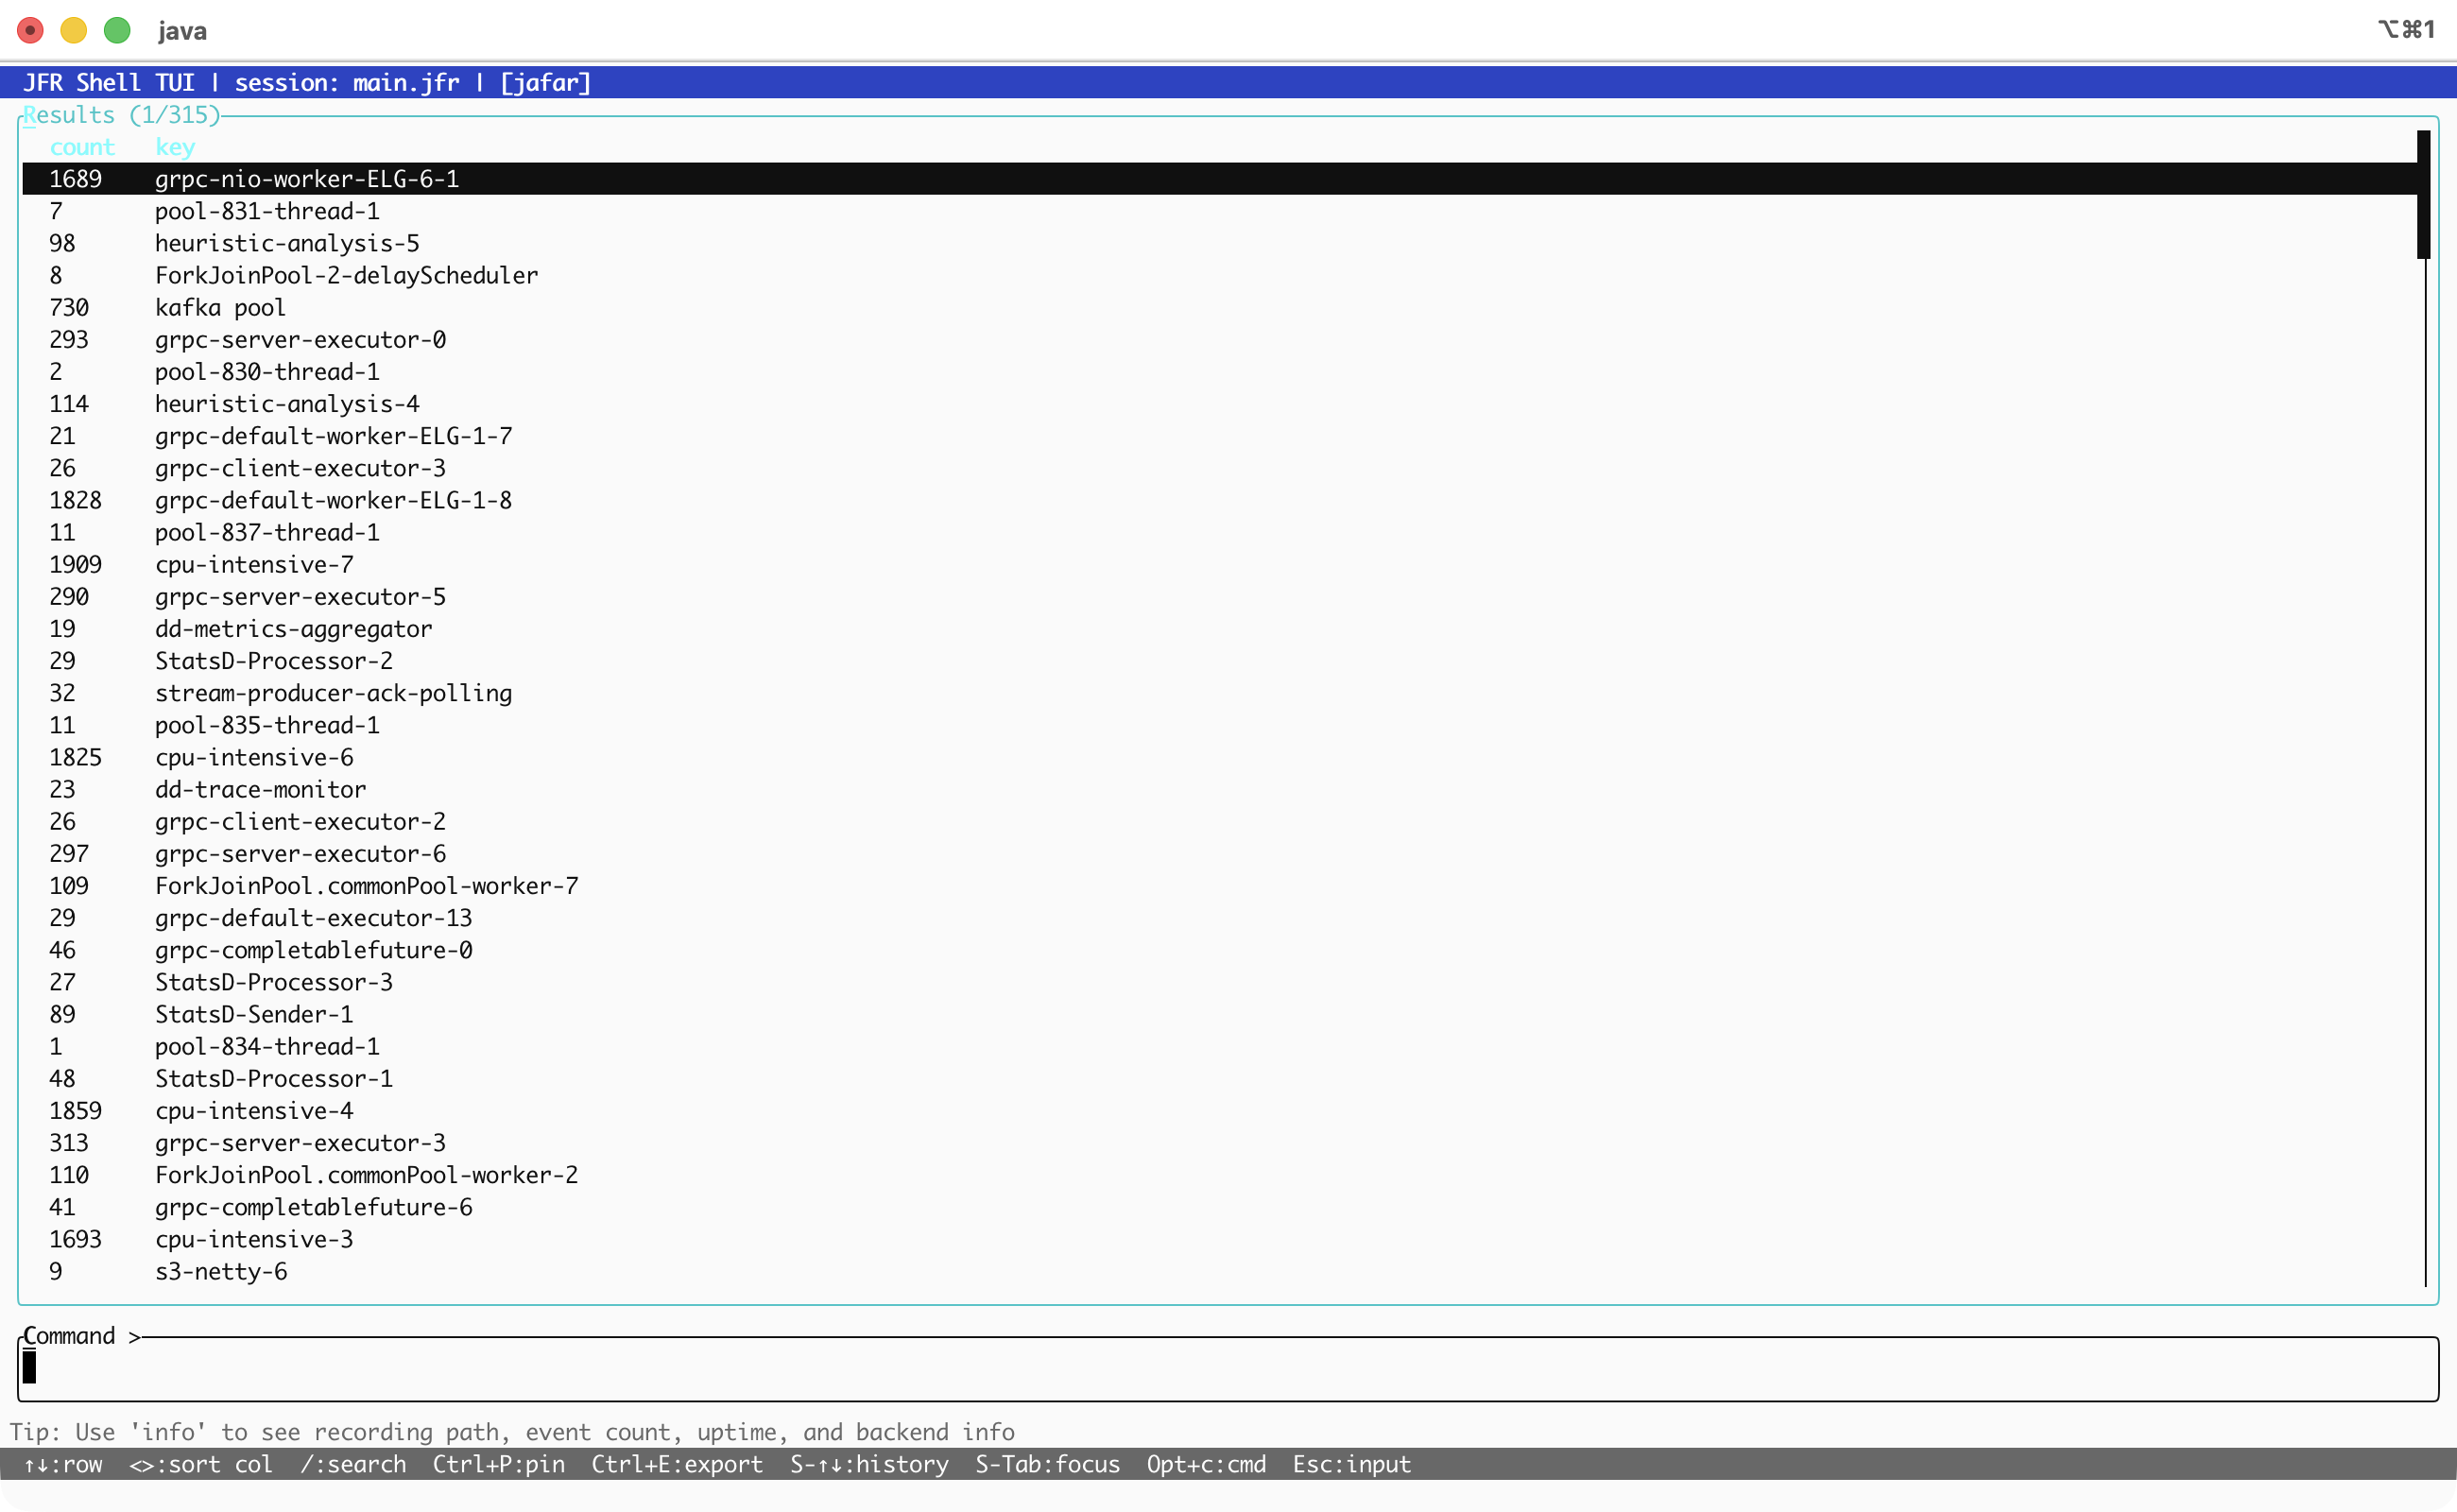
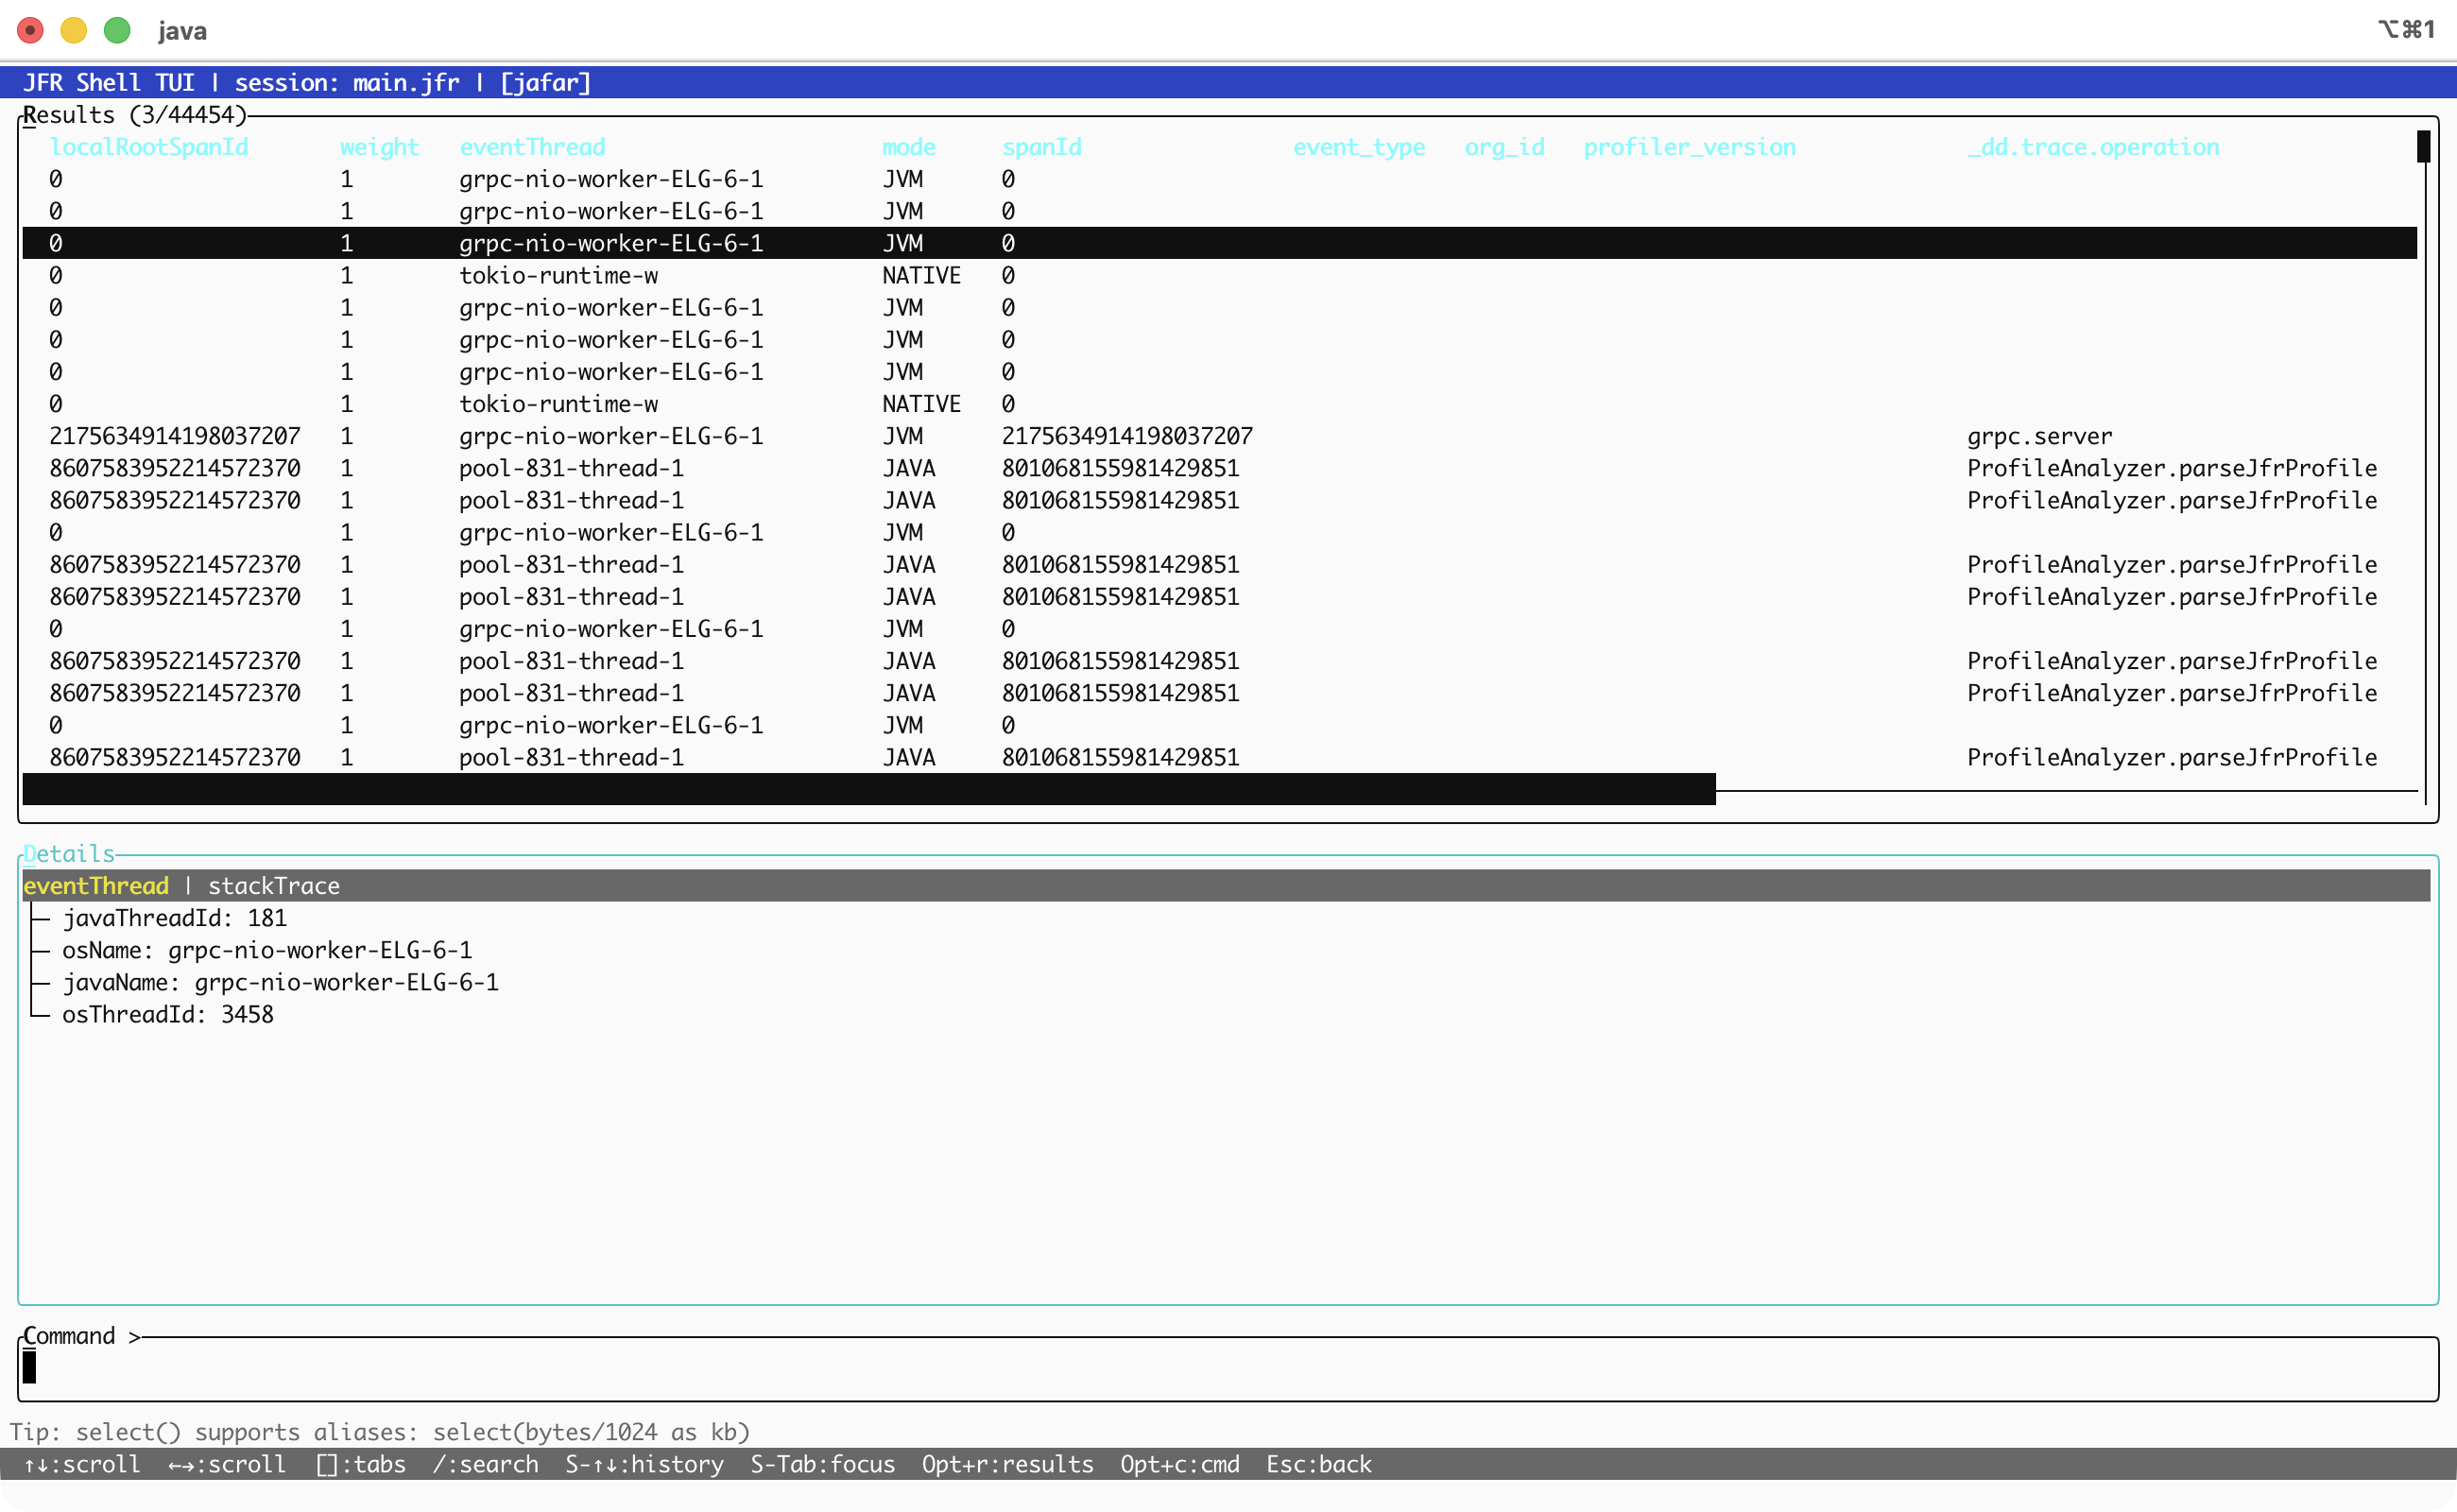
<p><img src="/assets/images/2026-02-23-jfr-shell-tui/tui-overview.png" alt="TUI overview" /></p>

<h2 id="the-layout">The Layout</h2>

<p>The screen is divided into a few fixed zones, top to bottom:</p>

<ul>
  <li><strong>Status bar</strong> - shows the active session and recording name</li>
  <li><strong>Results pane</strong> - your query output, rendered as a table or tree</li>
  <li><strong>Command input</strong> - where you type, with the familiar <code class="language-plaintext highlighter-rouge">jfr&gt;</code> prompt</li>
  <li><strong>Tips &amp; hints</strong> - rotating usage tips and context-aware keyboard shortcuts</li>
</ul>

<p>The results pane is the main attraction. It holds a navigable table with row selection, column sorting, and horizontal scrolling. No more piping into <code class="language-plaintext highlighter-rouge">less</code> and pretending that’s ergonomic.</p>

<h2 id="tabs">Tabs</h2>

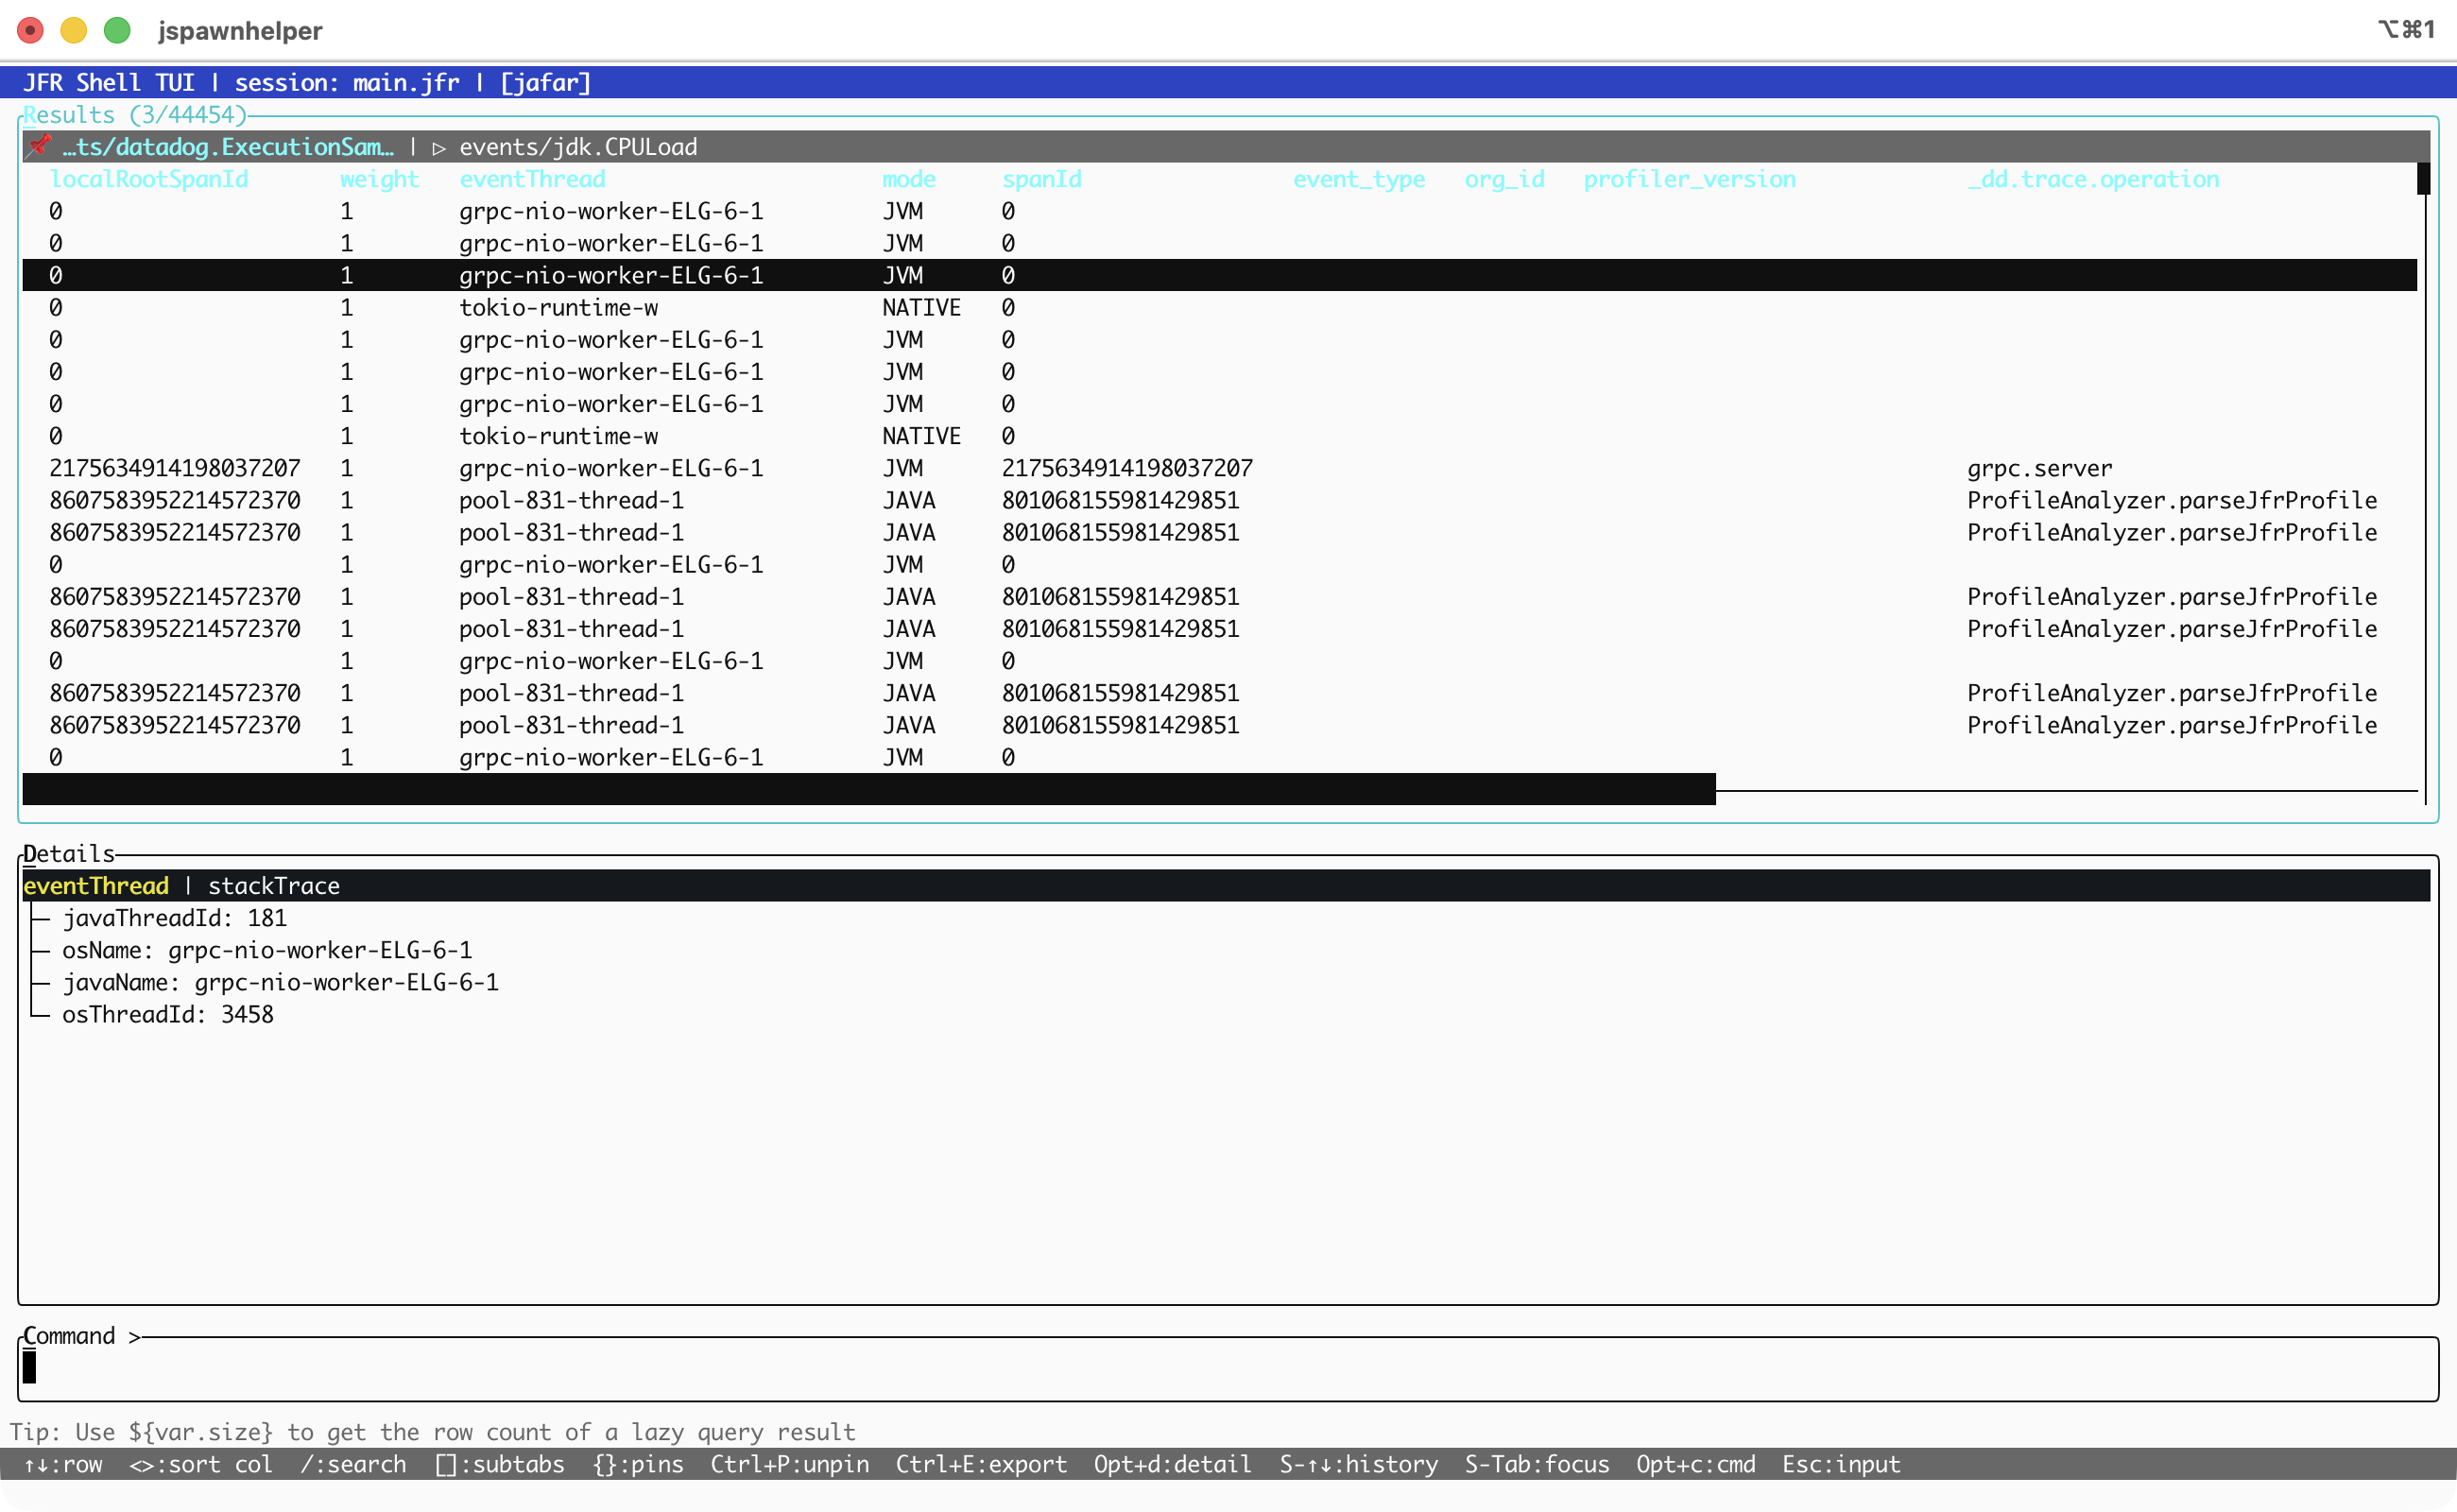
<p>By default each command is rendered into a scratch-tab — it will get replaced by the next command. Pin the tab with <code class="language-plaintext highlighter-rouge">Ctrl+P</code> to prevent it from being overwritten. Pinned tabs stick around and you can switch between them with <code class="language-plaintext highlighter-rouge">{</code> and <code class="language-plaintext highlighter-rouge">}</code>.</p>

<!-- SCREENSHOT: tui-tabs.png
     Capture: Run 3-4 different queries to create multiple tabs.
     Pin one tab (Ctrl+P). The pinned tab should show the pin icon.
     Focus should be on a tab that is NOT the first one, so the tab bar
     shows multiple tabs with the active one highlighted. -->
<p><img src="/assets/images/2026-02-23-jfr-shell-tui/tui-tabs.png" alt="Multiple tabs with pinning" /></p>

<h2 id="search-and-filter">Search and Filter</h2>

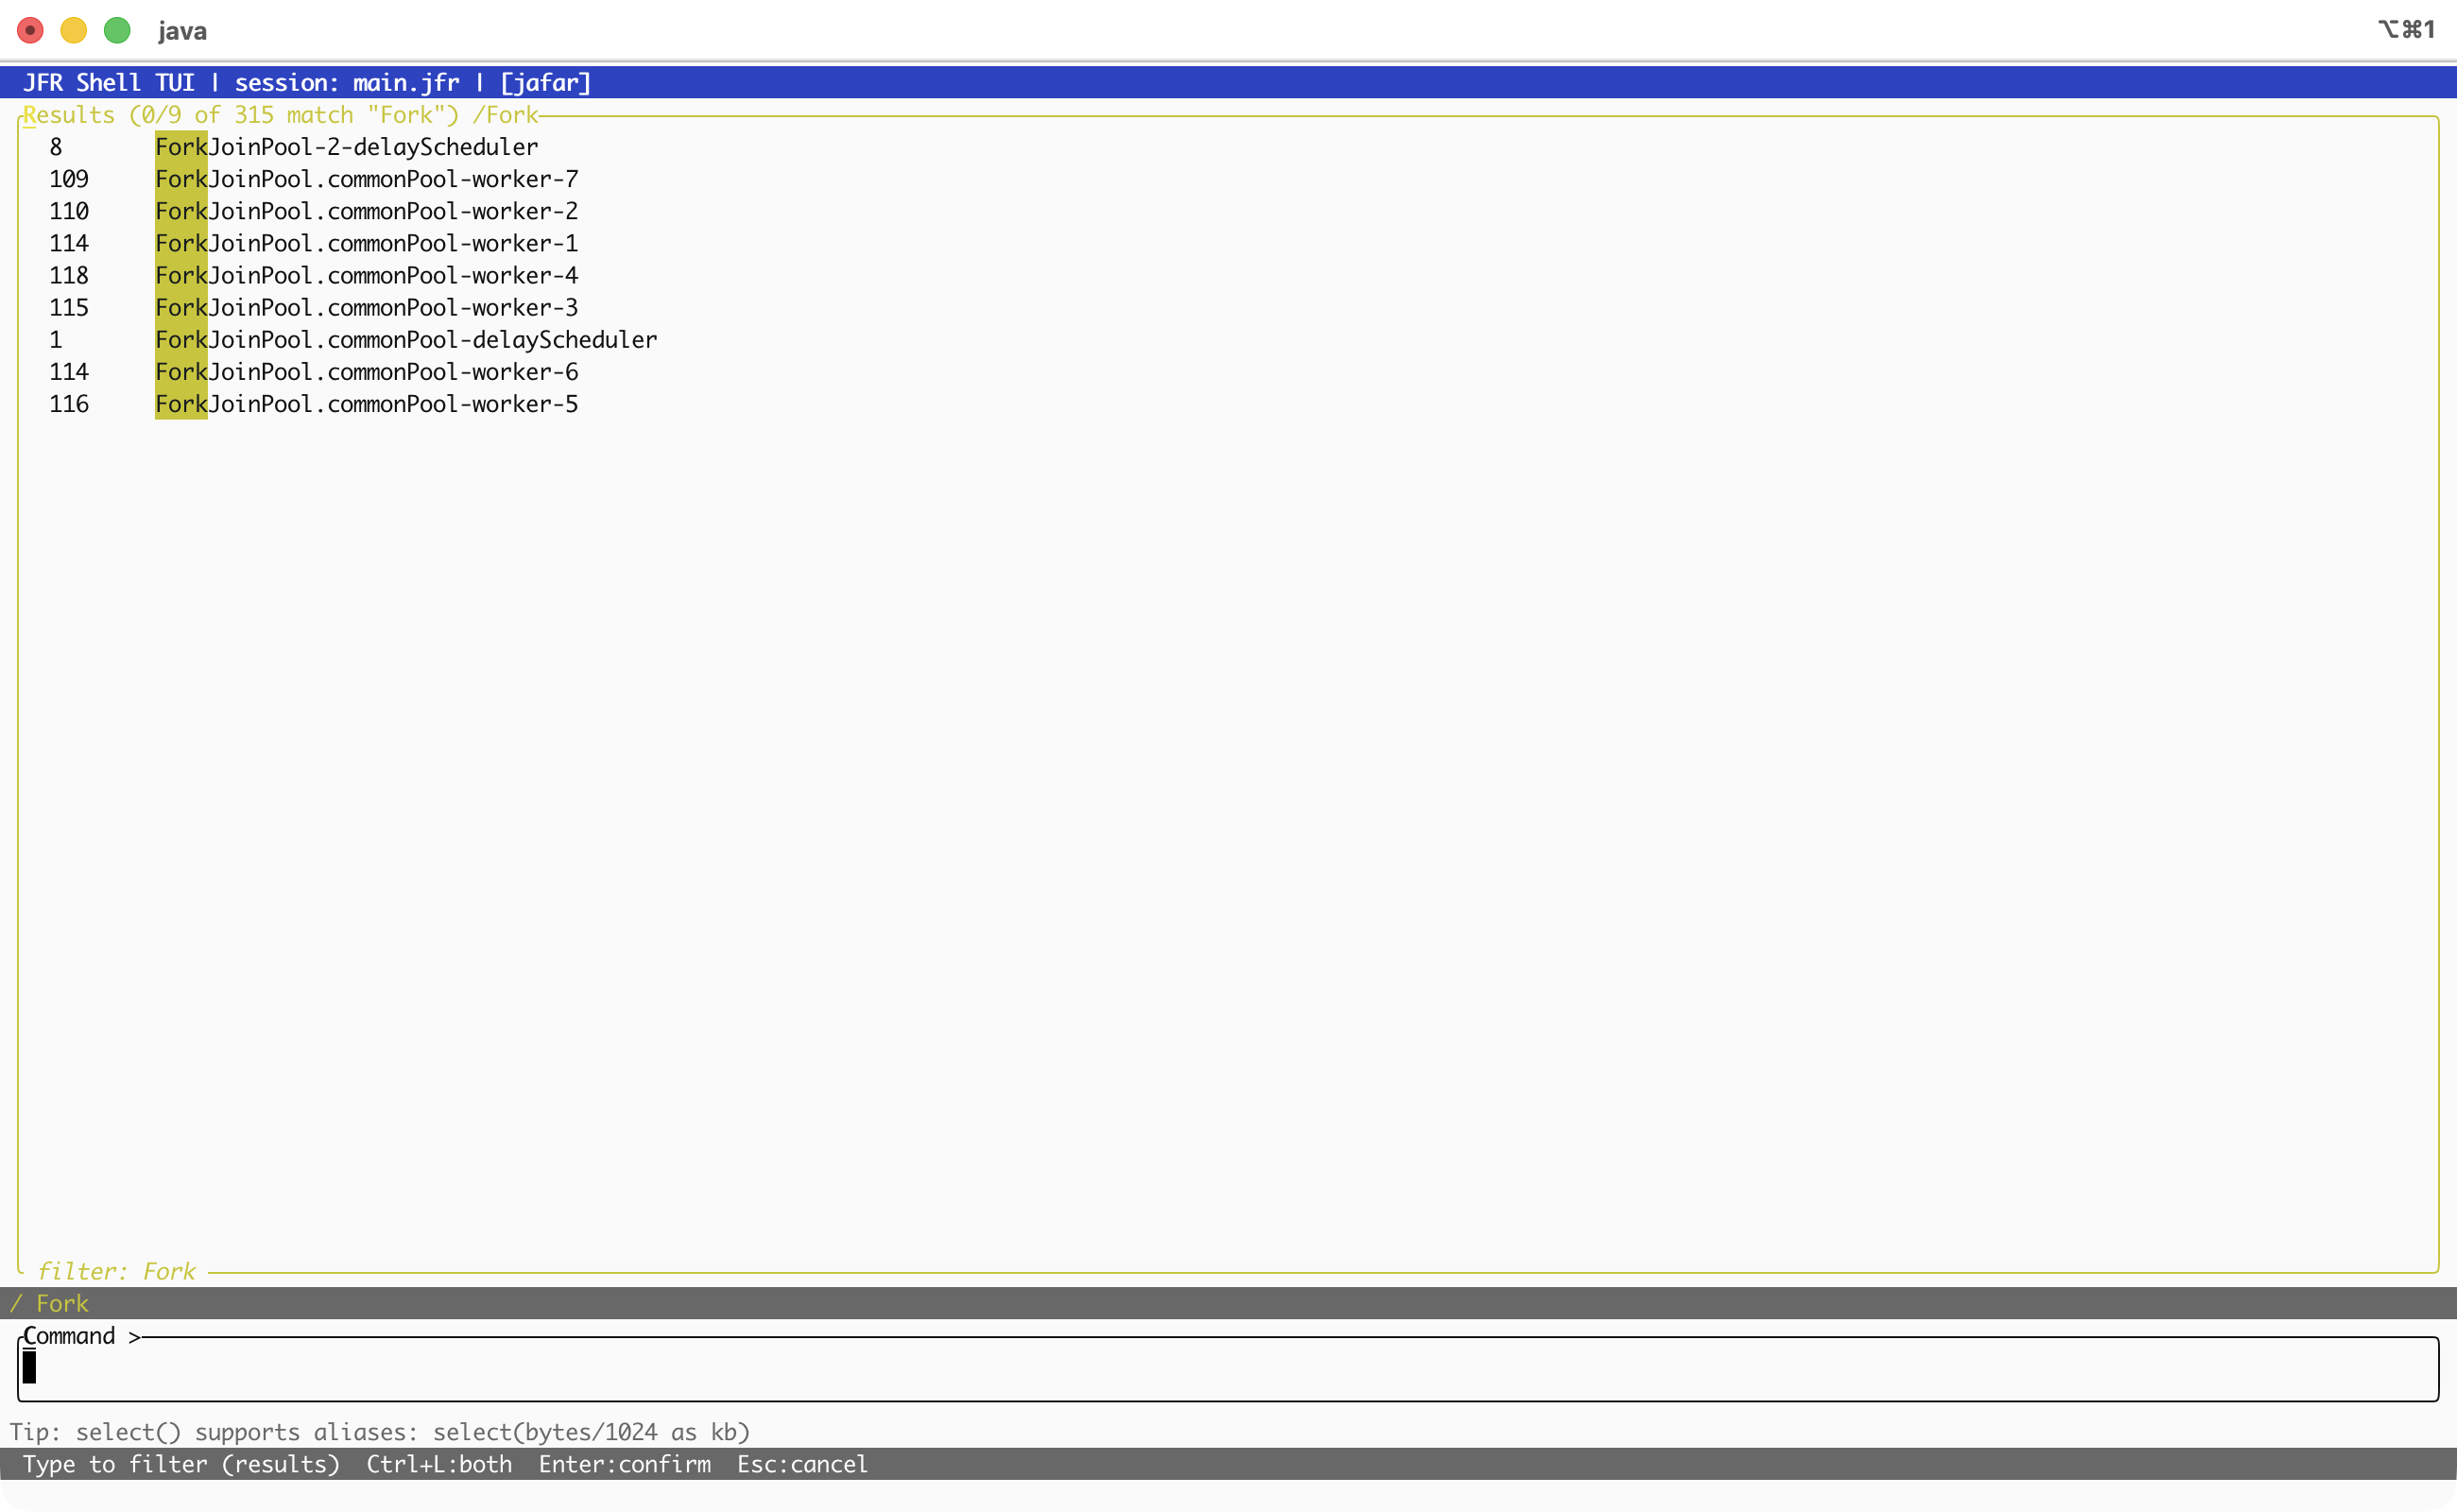
<p>Press <code class="language-plaintext highlighter-rouge">Ctrl+F</code> and start typing. The table filters in real time - only rows containing your search term are shown, with matches highlighted in yellow. The status line shows the hit count. Press <code class="language-plaintext highlighter-rouge">Enter</code> to lock the filter, <code class="language-plaintext highlighter-rouge">Esc</code> to cancel.</p>

<p>This works the same way you would expect from any reasonable tool: case-insensitive, substring match, instant feedback.</p>

<!-- SCREENSHOT: tui-search.png
     Capture: Run a query with many rows (eg. events/datadog.ExecutionSample | groupBy(eventThread.javaName)).
     Press Ctrl+F and type a partial thread name (e.g. "Fork" or "GC").
     Show the search bar active with the filter applied,
     matching rows visible, and the match count displayed. -->
<p><img src="/assets/images/2026-02-23-jfr-shell-tui/tui-search.png" alt="Live search and filter" /></p>

<h2 id="sorting">Sorting</h2>

<p><code class="language-plaintext highlighter-rouge">&lt;</code> and <code class="language-plaintext highlighter-rouge">&gt;</code> cycle through sort columns. <code class="language-plaintext highlighter-rouge">Alt+r</code> reverses the sort direction. The currently sorted column is indicated in the header. Combined with filtering, this lets you answer questions like “which thread had the most samples” without writing a <code class="language-plaintext highlighter-rouge">top()</code> aggregation.</p>

<h2 id="the-detail-pane">The Detail Pane</h2>

<p>Select a row and press <code class="language-plaintext highlighter-rouge">Enter</code>. The results pane splits: the table stays on the left (60%), and a detail view appears on the right (40%). The detail view shows the full structure of the selected row, rendered as a tree, with nested fields, annotations, and type information all expanded.</p>

<p>This is where the TUI earns its keep. In the old REPL, inspecting a complex event meant running <code class="language-plaintext highlighter-rouge">show metadata</code> in a separate query, cross-referencing field names, and hoping your mental model held. Now you just arrow down to a row and hit Enter.</p>

<!-- SCREENSHOT: tui-detail.png
     Capture: Run a query that produces rows with complex/nested data.
     Good candidates: events/datadog.ExecutionSample (has stackTrace field),
     or events/datadog.ObjectSample.
     Select a row and press Enter to open the detail pane.
     Show the split view: table on left, detail tree on right. -->
<p><img src="/assets/images/2026-02-23-jfr-shell-tui/tui-detail.png" alt="Detail pane with split view" /></p>

<p>Detail subtabs (switch with <code class="language-plaintext highlighter-rouge">[</code> and <code class="language-plaintext highlighter-rouge">]</code>) let you inspect different aspects of the selected row. <code class="language-plaintext highlighter-rouge">Shift+Tab</code> moves focus between the results table and the detail pane. The detail pane has its own scrolling, its own search (<code class="language-plaintext highlighter-rouge">Ctrl+F</code> while focused there), and its own cursor navigation.</p>

<h2 id="event-browser">Event Browser</h2>

<p>Type <code class="language-plaintext highlighter-rouge">events</code> to see every event type present in the recording, listed as a navigable table with event counts. This is the starting point for exploring an unfamiliar recording - you see what’s there before writing any queries.</p>

<!-- SCREENSHOT: tui-events.png
     Capture: Run: events
     Show the event type listing with counts. -->
<p><img src="/assets/images/2026-02-23-jfr-shell-tui/tui-events.png" alt="Event browser" /></p>

<h2 id="constant-pool-browser">Constant Pool Browser</h2>

<p>The constant pool browser is one of those features that sounds niche until you need it - and then it’s the only thing that matters.</p>

<p>Type <code class="language-plaintext highlighter-rouge">constants</code> to see all constant pool types. Select a type and press <code class="language-plaintext highlighter-rouge">Enter</code> to browse its entries, or type <code class="language-plaintext highlighter-rouge">constants jdk.types.Symbol</code> to jump straight to a specific type. Navigate with arrow keys, press <code class="language-plaintext highlighter-rouge">Ctrl+F</code> to filter the type list.</p>

<p>For large constant pools, entries are paginated automatically so the UI stays responsive even when a recording has hundreds of thousands of entries.</p>

<!-- SCREENSHOT: tui-browser.png
     Capture: Run: constants
     Show the constant pool type listing. -->
<p><img src="/assets/images/2026-02-23-jfr-shell-tui/tui-browser.png" alt="Constant pool browser" /></p>

<h2 id="metadata">Metadata</h2>

<p><code class="language-plaintext highlighter-rouge">metadata</code> lists every event, type and annotation defined in the recording as a navigable table. Field names, types, dimensions - all browsable without leaving the TUI.</p>

<!-- SCREENSHOT: tui-metadata.png
     Capture: Run: metadata
     Show the metadata table with event types listed. -->
<p><img src="/assets/images/2026-02-23-jfr-shell-tui/tui-metadata.png" alt="Metadata view" /></p>

<h2 id="session-switching">Session Switching</h2>

<p>Working with multiple recordings is common when doing comparative analysis - “before” and “after” a change, or multiple services in a distributed trace. <code class="language-plaintext highlighter-rouge">Alt+s</code> opens a session picker overlay. Arrow to the session you want, hit Enter. The results pane updates to show results from the new active session.</p>

<h2 id="completion">Completion</h2>

<p><code class="language-plaintext highlighter-rouge">Tab</code> in the command input opens a completion popup. It’s context-aware: event type names after <code class="language-plaintext highlighter-rouge">events/</code>, field paths in filters, function names in aggregations, file paths after <code class="language-plaintext highlighter-rouge">open</code>. Type to narrow the list, arrow keys to select, Enter to accept.</p>

<!-- SCREENSHOT: tui-completion.png
     Capture: Type "events/jdk." in the command input and press Tab.
     Show the completion popup with event type suggestions filtered
     to the jdk namespace. -->
<p><img src="/assets/images/2026-02-23-jfr-shell-tui/tui-completion.png" alt="Tab completion popup" /></p>

<h2 id="export">Export</h2>

<p><code class="language-plaintext highlighter-rouge">Ctrl+E</code> exports the active tab’s table data to a CSV file. A popup opens with a default path under <code class="language-plaintext highlighter-rouge">~/.jfr-shell/exports/</code>; edit it or just press Enter. Done. No more <code class="language-plaintext highlighter-rouge">--format csv &gt; output.csv</code> and rebuilding the query from memory.</p>

<h2 id="history">History</h2>

<p><code class="language-plaintext highlighter-rouge">Ctrl+R</code> opens reverse-i-search, exactly like bash. Start typing and it finds the most recent matching command. <code class="language-plaintext highlighter-rouge">Ctrl+R</code> again jumps to the next match. <code class="language-plaintext highlighter-rouge">Enter</code> accepts, <code class="language-plaintext highlighter-rouge">Esc</code> cancels. Command history persists across sessions in <code class="language-plaintext highlighter-rouge">~/.jfr-shell/history</code>.</p>

<p>Combined with <code class="language-plaintext highlighter-rouge">Shift+Up/Down</code> for simple history scrolling, you never have to retype a query.</p>

<h2 id="cell-picker">Cell Picker</h2>

<p>Press <code class="language-plaintext highlighter-rouge">@</code> to open a popup listing every field and value of the currently selected row. Arrow to the one you want, press Enter — the value is inserted into the command input and copied to the clipboard. Useful for grabbing a thread name, stack trace hash, or constant pool ID without retyping it.</p>

<p><img src="/assets/images/2026-02-23-jfr-shell-tui/tui-picker.png" alt="Cell picker popup" /></p>

<h2 id="the-keyboard-cheat-sheet">The Keyboard Cheat Sheet</h2>

<p>The hints bar at the bottom of the screen adapts to the current focus. When you’re in the results pane, it shows shortcuts like <code class="language-plaintext highlighter-rouge">↑↓:row  &lt;&gt;:sort col  Ctrl+F:search  Ctrl+P:pin</code>. When you’re in the command input, it shows <code class="language-plaintext highlighter-rouge">Enter:run  Tab:complete  Ctrl+R:search history</code>. It’s always telling you what’s available without you having to memorize anything.</p>

<p>Here’s the full set:</p>

<table>
  <thead>
    <tr>
      <th>Context</th>
      <th>Key</th>
      <th>Action</th>
    </tr>
  </thead>
  <tbody>
    <tr>
      <td>Global</td>
      <td><code class="language-plaintext highlighter-rouge">{</code> / <code class="language-plaintext highlighter-rouge">}</code></td>
      <td>Switch tabs</td>
    </tr>
    <tr>
      <td>Global</td>
      <td><code class="language-plaintext highlighter-rouge">Ctrl+P</code></td>
      <td>Pin/unpin tab</td>
    </tr>
    <tr>
      <td>Global</td>
      <td><code class="language-plaintext highlighter-rouge">Ctrl+E</code></td>
      <td>Export to CSV</td>
    </tr>
    <tr>
      <td>Global</td>
      <td><code class="language-plaintext highlighter-rouge">Ctrl+R</code></td>
      <td>History search</td>
    </tr>
    <tr>
      <td>Global</td>
      <td><code class="language-plaintext highlighter-rouge">Alt+s</code></td>
      <td>Session picker</td>
    </tr>
    <tr>
      <td>Results</td>
      <td><code class="language-plaintext highlighter-rouge">Ctrl+F</code></td>
      <td>Search/filter</td>
    </tr>
    <tr>
      <td>Results</td>
      <td><code class="language-plaintext highlighter-rouge">&lt;</code> / <code class="language-plaintext highlighter-rouge">&gt;</code></td>
      <td>Sort by column</td>
    </tr>
    <tr>
      <td>Results</td>
      <td><code class="language-plaintext highlighter-rouge">Alt+r</code></td>
      <td>Reverse sort</td>
    </tr>
    <tr>
      <td>Results</td>
      <td><code class="language-plaintext highlighter-rouge">Enter</code></td>
      <td>Open detail pane</td>
    </tr>
    <tr>
      <td>Results</td>
      <td><code class="language-plaintext highlighter-rouge">Alt+d</code></td>
      <td>Jump to detail</td>
    </tr>
    <tr>
      <td>Results</td>
      <td><code class="language-plaintext highlighter-rouge">Shift+Tab</code></td>
      <td>Cycle focus</td>
    </tr>
    <tr>
      <td>Detail</td>
      <td><code class="language-plaintext highlighter-rouge">[</code> / <code class="language-plaintext highlighter-rouge">]</code></td>
      <td>Switch subtabs</td>
    </tr>
    <tr>
      <td>Detail</td>
      <td><code class="language-plaintext highlighter-rouge">Ctrl+F</code></td>
      <td>Search in detail</td>
    </tr>
    <tr>
      <td>Detail</td>
      <td><code class="language-plaintext highlighter-rouge">Alt+r</code></td>
      <td>Jump to results</td>
    </tr>
    <tr>
      <td>Input</td>
      <td><code class="language-plaintext highlighter-rouge">Tab</code></td>
      <td>Completion</td>
    </tr>
    <tr>
      <td>Input</td>
      <td><code class="language-plaintext highlighter-rouge">@</code></td>
      <td>Cell picker</td>
    </tr>
    <tr>
      <td>Input</td>
      <td><code class="language-plaintext highlighter-rouge">Alt+r</code></td>
      <td>Jump to results</td>
    </tr>
    <tr>
      <td>Input</td>
      <td><code class="language-plaintext highlighter-rouge">Alt+c</code></td>
      <td>Jump to command</td>
    </tr>
    <tr>
      <td>Search</td>
      <td><code class="language-plaintext highlighter-rouge">Ctrl+L</code></td>
      <td>Apply to both panes</td>
    </tr>
  </tbody>
</table>

<h2 id="under-the-hood">Under the Hood</h2>

<p>The TUI is built on <a href="https://github.com/jbachorik/tamboui">TamboUI</a>, a Java terminal UI framework inspired by Rust’s <a href="https://ratatui.rs/">ratatui</a>. TamboUI provides the widget set (tables, trees, text inputs, tabs, scrollbars, blocks with borders), the constraint-based layout system, and the styling primitives. jfr-shell composes these into the full-screen application.</p>

<p>The rendering loop is simple: draw the frame, wait for input with a 100ms timeout, handle the keystroke, repeat. Commands execute asynchronously in a background thread, with a braille spinner animation in the status area while they run. Results stream into the active tab as they arrive.</p>

<p>The terminal backend is JLine-based, using raw mode for direct keystroke capture and the alternate screen buffer so your shell history stays clean when you exit.</p>

<p>No external GUI dependencies. No Electron. No web browser. Just ANSI escape codes and a well-organized widget tree.</p>

<h2 id="try-it">Try It</h2>

<div class="language-bash highlighter-rouge"><div class="highlight"><pre class="highlight"><code><span class="c"># JBang (easiest)</span>
jbang jafar-shell@btraceio <span class="nt">--tui</span>
jfr&gt; open recording.jfr

<span class="c"># Or build from source</span>
./gradlew :jfr-shell:shadowJar
java <span class="nt">-jar</span> jfr-shell/build/libs/jfr-shell-<span class="k">*</span><span class="nt">-all</span>.jar <span class="nt">--tui</span>
</code></pre></div></div>

<p>If you have been using jfr-shell in REPL mode and getting by just fine, the TUI won’t change what you can do. It changes how it feels to do it. Queries that used to involve scrolling, re-running, and squinting now involve pointing and pressing Enter.</p>

<p>The REPL is still there, unchanged, for scripts and non-interactive use. <code class="language-plaintext highlighter-rouge">--tui</code> is strictly additive.</p>

<hr />

<p><em>jfr-shell 0.14.2 is available on <a href="https://central.sonatype.com/">Maven Central</a> and via <a href="https://jbang.dev">JBang</a>. Source on <a href="https://github.com/jbachorik/jafar">GitHub</a>.</em></p>]]></content><author><name></name></author><category term="java" /><category term="jfr" /><category term="tui" /><category term="performance" /><category term="jfr" /><category term="jfr-shell" /><category term="tui" /><category term="terminal" /><category term="profiling" /><category term="jafar" /><summary type="html"><![CDATA[]]></summary></entry><entry><title type="html">Debugging the OTLP Profile Attribute Indices Mystery</title><link href="/posts/otlp-profile-attribute-indices-mystery" rel="alternate" type="text/html" title="Debugging the OTLP Profile Attribute Indices Mystery" /><published>2025-12-05T00:00:00+00:00</published><updated>2025-12-05T00:00:00+00:00</updated><id>/posts/otlp-profile-attribute-indices-mystery</id><content type="html" xml:base="/posts/otlp-profile-attribute-indices-mystery"><![CDATA[<p>This is the story of how a handful of integers managed to gaslight three separate tools, a Docker container, one human, and a very unimpressed cat on a radiator, while rain hammered the windows and the logs scrolled by like sleet.</p>

<p>The short version:<br />
our OTLP profiles were <strong>perfectly valid</strong> according to <code class="language-plaintext highlighter-rouge">protoc</code>, but <code class="language-plaintext highlighter-rouge">profcheck</code> insisted our <code class="language-plaintext highlighter-rouge">attribute_indices</code> were out of range.<br />
The long version is below. It involves:</p>

<ul>
  <li>An evening that felt like November at 16:30</li>
  <li>Two different proto schemas with the same message name</li>
  <li>Field numbers quietly rearranged between commits</li>
  <li>A cat that refused to care</li>
</ul>

<hr />

<h2 id="1-the-symptom-profcheck-vs-reality">1. The Symptom: Profcheck vs. Reality</h2>

<p>We were adding <strong>sample attributes support</strong> to an OTLP profiles converter. The flow was:</p>

<ol>
  <li>Convert internal data → OTLP <code class="language-plaintext highlighter-rouge">ProfilesData</code></li>
  <li>Serialize to protobuf</li>
  <li>Validate using:
    <ul>
      <li><code class="language-plaintext highlighter-rouge">protoc</code> (canonical protobuf implementation)</li>
      <li><code class="language-plaintext highlighter-rouge">profcheck</code> (OpenTelemetry profile validator)</li>
    </ul>
  </li>
</ol>

<p>The results:</p>

<ul>
  <li><code class="language-plaintext highlighter-rouge">protoc</code>: ✅ all good</li>
  <li><code class="language-plaintext highlighter-rouge">profcheck</code>: ❌ screaming about <code class="language-plaintext highlighter-rouge">attribute_indices</code></li>
</ul>

<p>The errors looked like:</p>

<div class="language-text highlighter-rouge"><div class="highlight"><pre class="highlight"><code>sample[0]: attribute_indices: [0]: index 2 is out of range [0..2)
sample[1]: attribute_indices: [0]: index 3 is out of range [0..2)
sample[2]: attribute_indices: [0]: index 4 is out of range [0..2)
...
sample[99]: attribute_indices: [0]: index 101 is out of range [0..2)
</code></pre></div></div>

<p>We expected every sample to reference a <strong>single attribute</strong> at index <code class="language-plaintext highlighter-rouge">1</code>. Instead, we got a nice ascending staircase: <code class="language-plaintext highlighter-rouge">2, 3, 4, …, 101</code>.</p>

<p>On a good day, that pattern would be annoying. On a cold, wet evening with terminal light reflecting off the window and the cat side-eyeing the radiator, it was downright offensive.</p>

<hr />

<h2 id="2-context-what-we-thought-we-were-encoding">2. Context: What We Thought We Were Encoding</h2>

<p>We had a simple model:</p>

<ul>
  <li><code class="language-plaintext highlighter-rouge">AttributeTable</code>
    <ul>
      <li>Index <code class="language-plaintext highlighter-rouge">0</code>: sentinel</li>
      <li>Index <code class="language-plaintext highlighter-rouge">1</code>: <code class="language-plaintext highlighter-rouge">"sample.type: cpu"</code></li>
    </ul>
  </li>
  <li>Each sample:
    <ul>
      <li><code class="language-plaintext highlighter-rouge">attribute_indices = [1]</code></li>
    </ul>
  </li>
</ul>

<p>Quick debug logging:</p>

<div class="language-java highlighter-rouge"><div class="highlight"><pre class="highlight"><code><span class="nc">System</span><span class="o">.</span><span class="na">out</span><span class="o">.</span><span class="na">println</span><span class="o">(</span><span class="s">"AttributeTable size: "</span> <span class="o">+</span> <span class="n">attributeTable</span><span class="o">.</span><span class="na">size</span><span class="o">());</span>
<span class="nc">System</span><span class="o">.</span><span class="na">out</span><span class="o">.</span><span class="na">println</span><span class="o">(</span><span class="s">"Sample attributeIndices: "</span> <span class="o">+</span> <span class="nc">Arrays</span><span class="o">.</span><span class="na">toString</span><span class="o">(</span><span class="n">sample</span><span class="o">.</span><span class="na">attributeIndices</span><span class="o">));</span>
</code></pre></div></div>

<p>Output:</p>

<div class="language-text highlighter-rouge"><div class="highlight"><pre class="highlight"><code>AttributeTable size: 2  // [0]=sentinel, [1]=sample.type:cpu
Sample attributeIndices: [1]
</code></pre></div></div>

<p>So in memory:</p>

<ul>
  <li>Table size is correct</li>
  <li>Index is correct</li>
  <li>Everything looks boringly sane</li>
</ul>

<p>This is the point where you start suspecting the <strong>wire format</strong>.</p>

<hr />

<h2 id="3-wire-format-autopsy">3. Wire Format Autopsy</h2>

<h3 id="31-first-hex-dump-the-red-herring">3.1. First Hex Dump (The Red Herring)</h3>

<p>We dumped the file:</p>

<div class="language-bash highlighter-rouge"><div class="highlight"><pre class="highlight"><code>hexdump <span class="nt">-C</span> /tmp/debug_cpu.pb | <span class="nb">head</span> <span class="nt">-50</span>
</code></pre></div></div>

<p>We saw patterns like:</p>

<div class="language-text highlighter-rouge"><div class="highlight"><pre class="highlight"><code>08 01 10 01 18 02 22 01 01 2a 08 ...
08 01 10 01 18 03 22 01 01 2a 08 ...
08 01 10 01 18 04 22 01 01 2a 08 ...
</code></pre></div></div>

<p>Decoding:</p>

<ul>
  <li><code class="language-plaintext highlighter-rouge">08</code> = <code class="language-plaintext highlighter-rouge">(1 &lt;&lt; 3) | 0</code> → field <strong>1</strong>, wire type <strong>0</strong> (varint) → <code class="language-plaintext highlighter-rouge">stack_index</code></li>
  <li>
    <p><code class="language-plaintext highlighter-rouge">01</code> = value <strong>1</strong></p>
  </li>
  <li><code class="language-plaintext highlighter-rouge">10</code> = <code class="language-plaintext highlighter-rouge">(2 &lt;&lt; 3) | 0</code> → field <strong>2</strong>, wire type <strong>0</strong> (varint)</li>
  <li>
    <p><code class="language-plaintext highlighter-rouge">01</code> = value <strong>1</strong></p>
  </li>
  <li><code class="language-plaintext highlighter-rouge">18</code> = <code class="language-plaintext highlighter-rouge">(3 &lt;&lt; 3) | 0</code> → field <strong>3</strong>, wire type <strong>0</strong> (varint)</li>
  <li>
    <p><code class="language-plaintext highlighter-rouge">02/03/04</code> = incrementing values (looked like <code class="language-plaintext highlighter-rouge">link_index</code>)</p>
  </li>
  <li><code class="language-plaintext highlighter-rouge">22</code> = <code class="language-plaintext highlighter-rouge">(4 &lt;&lt; 3) | 2</code> → field <strong>4</strong>, wire type <strong>2</strong> (length-delimited)</li>
  <li><code class="language-plaintext highlighter-rouge">01 01</code> = packed length <strong>1</strong>, value <code class="language-plaintext highlighter-rouge">[1]</code></li>
</ul>

<p>At first glance, this suggested:</p>

<ul>
  <li>Field 2 was being emitted as a <strong>single varint</strong>, not a <strong>packed repeated field</strong></li>
  <li>
    <p>That clashed with our encoder call:</p>

    <div class="language-java highlighter-rouge"><div class="highlight"><pre class="highlight"><code><span class="n">encoder</span><span class="o">.</span><span class="na">writePackedVarintField</span><span class="o">(</span>
    <span class="nc">OtlpProtoFields</span><span class="o">.</span><span class="na">Sample</span><span class="o">.</span><span class="na">ATTRIBUTE_INDICES</span><span class="o">,</span> <span class="n">sample</span><span class="o">.</span><span class="na">attributeIndices</span><span class="o">);</span>
</code></pre></div>    </div>
  </li>
</ul>

<p>So either:</p>

<ol>
  <li>The encoder was misbehaving, or</li>
  <li>We were looking at the wrong file</li>
</ol>

<p>The cat, being more experienced with humans than protobuf, silently voted for (2).</p>

<h3 id="32-the-stale-artifact">3.2. The Stale Artifact</h3>

<p>That hex dump was from an <strong>old debug file</strong> generated before recent refactoring.</p>

<p>After:</p>

<div class="language-bash highlighter-rouge"><div class="highlight"><pre class="highlight"><code><span class="nb">rm</span> /tmp/debug_cpu.pb
<span class="c"># rebuild + rerun generator</span>
hexdump <span class="nt">-C</span> /tmp/debug_cpu.pb | <span class="nb">head</span> <span class="nt">-50</span>
</code></pre></div></div>

<p>…the wire format now matched the expected packed encoding, and <code class="language-plaintext highlighter-rouge">protoc</code> decoding aligned perfectly with our structures.</p>

<p>So:</p>

<ul>
  <li>Fresh <code class="language-plaintext highlighter-rouge">.pb</code> → ✔</li>
  <li>Our own decoder → ✔</li>
  <li><code class="language-plaintext highlighter-rouge">protoc</code> → ✔</li>
  <li><code class="language-plaintext highlighter-rouge">profcheck</code> → still ❌</li>
</ul>

<p>Verdict: the problem was not “we wrote garbage.” It was “someone else is reading it differently.”</p>

<p>Outside, the rain kept going. Inside, the cat fell asleep. We moved on.</p>

<hr />

<h2 id="4-calling-in-protoc-as-referee">4. Calling in Protoc as Referee</h2>

<p>We wired in a canonical decode using the <strong>trunk</strong> OTLP profiles proto:</p>

<div class="language-bash highlighter-rouge"><div class="highlight"><pre class="highlight"><code>protoc <span class="nt">--decode</span><span class="o">=</span>opentelemetry.proto.profiles.v1development.ProfilesData <span class="se">\</span>
    <span class="nt">--proto_path</span><span class="o">=</span>/proto/opentelemetry-proto <span class="se">\</span>
    opentelemetry/proto/profiles/v1development/profiles.proto <span class="se">\</span>
    &lt; profile.pb
</code></pre></div></div>

<p>Result:</p>

<ul>
  <li><code class="language-plaintext highlighter-rouge">protoc</code> decoded without complaint</li>
  <li>The decoded <code class="language-plaintext highlighter-rouge">ProfilesData</code> matched the trunk proto layout</li>
  <li><code class="language-plaintext highlighter-rouge">attribute_indices</code> were <code class="language-plaintext highlighter-rouge">[1]</code> everywhere</li>
</ul>

<p>So for the schema we pointed <code class="language-plaintext highlighter-rouge">protoc</code> at:</p>

<ul>
  <li>Our payload was <strong>100% spec-compliant</strong></li>
  <li>Our data matched expectations</li>
</ul>

<p>At this point, there were only two realistic options:</p>

<ol>
  <li><code class="language-plaintext highlighter-rouge">profcheck</code> is buggy</li>
  <li><code class="language-plaintext highlighter-rouge">profcheck</code> is using a <strong>different schema</strong> than the one we’re validating against</li>
</ol>

<p>Option (2) is more boring and much more likely.</p>

<hr />

<h2 id="5-profchecks-reality-the-go-module">5. Profcheck’s Reality: The Go Module</h2>

<p>The real turning point came from looking at the Go module docs:</p>

<blockquote>
  <p><a href="https://pkg.go.dev/go.opentelemetry.io/proto/otlp/profiles/v1development#Sample">https://pkg.go.dev/go.opentelemetry.io/proto/otlp/profiles/v1development#Sample</a></p>
</blockquote>

<p>The generated Go struct:</p>

<div class="language-go highlighter-rouge"><div class="highlight"><pre class="highlight"><code><span class="k">type</span> <span class="n">Sample</span> <span class="k">struct</span> <span class="p">{</span>
    <span class="n">StackIndex</span>         <span class="kt">int32</span>    <span class="s">`protobuf:"varint,1,opt,name=stack_index"`</span>
    <span class="n">Values</span>             <span class="p">[]</span><span class="kt">int64</span>  <span class="s">`protobuf:"varint,2,rep,packed,name=values"`</span>
    <span class="n">AttributeIndices</span>   <span class="p">[]</span><span class="kt">int32</span>  <span class="s">`protobuf:"varint,3,rep,packed,name=attribute_indices"`</span>
    <span class="n">LinkIndex</span>          <span class="kt">int32</span>    <span class="s">`protobuf:"varint,4,opt,name=link_index"`</span>
    <span class="n">TimestampsUnixNano</span> <span class="p">[]</span><span class="kt">uint64</span> <span class="s">`protobuf:"fixed64,5,rep,packed,name=timestamps_unix_nano"`</span>
<span class="p">}</span>
</code></pre></div></div>

<p>Field numbers <strong>according to the Go module</strong>:</p>

<ol>
  <li><code class="language-plaintext highlighter-rouge">stack_index</code> = <strong>1</strong></li>
  <li><code class="language-plaintext highlighter-rouge">values</code> = <strong>2</strong></li>
  <li><code class="language-plaintext highlighter-rouge">attribute_indices</code> = <strong>3</strong></li>
  <li><code class="language-plaintext highlighter-rouge">link_index</code> = <strong>4</strong></li>
  <li><code class="language-plaintext highlighter-rouge">timestamps_unix_nano</code> = <strong>5</strong></li>
</ol>

<p>Now compare that to the proto from GitHub <strong>trunk</strong>:</p>

<div class="language-protobuf highlighter-rouge"><div class="highlight"><pre class="highlight"><code><span class="kd">message</span> <span class="nc">Sample</span> <span class="p">{</span>
  <span class="kt">int32</span> <span class="na">stack_index</span> <span class="o">=</span> <span class="mi">1</span><span class="p">;</span>
  <span class="k">repeated</span> <span class="kt">int32</span> <span class="na">attribute_indices</span> <span class="o">=</span> <span class="mi">2</span><span class="p">;</span>
  <span class="kt">int32</span> <span class="na">link_index</span> <span class="o">=</span> <span class="mi">3</span><span class="p">;</span>
  <span class="k">repeated</span> <span class="kt">int64</span> <span class="na">values</span> <span class="o">=</span> <span class="mi">4</span><span class="p">;</span>
  <span class="k">repeated</span> <span class="kt">fixed64</span> <span class="na">timestamps_unix_nano</span> <span class="o">=</span> <span class="mi">5</span><span class="p">;</span>
<span class="p">}</span>
</code></pre></div></div>

<p>Field numbers <strong>in trunk</strong>:</p>

<ol>
  <li><code class="language-plaintext highlighter-rouge">stack_index</code> = <strong>1</strong></li>
  <li><code class="language-plaintext highlighter-rouge">attribute_indices</code> = <strong>2</strong></li>
  <li><code class="language-plaintext highlighter-rouge">link_index</code> = <strong>3</strong></li>
  <li><code class="language-plaintext highlighter-rouge">values</code> = <strong>4</strong></li>
  <li><code class="language-plaintext highlighter-rouge">timestamps_unix_nano</code> = <strong>5</strong></li>
</ol>

<p>Let’s put that into a table.</p>

<h3 id="51-field-number-mismatch">5.1. Field Number Mismatch</h3>

<table>
  <thead>
    <tr>
      <th>Logical field</th>
      <th>Trunk proto (GitHub)</th>
      <th>Go module (profcheck)</th>
    </tr>
  </thead>
  <tbody>
    <tr>
      <td><code class="language-plaintext highlighter-rouge">stack_index</code></td>
      <td>1</td>
      <td>1</td>
    </tr>
    <tr>
      <td><code class="language-plaintext highlighter-rouge">attribute_indices</code></td>
      <td>2</td>
      <td>3</td>
    </tr>
    <tr>
      <td><code class="language-plaintext highlighter-rouge">link_index</code></td>
      <td>3</td>
      <td>4</td>
    </tr>
    <tr>
      <td><code class="language-plaintext highlighter-rouge">values</code></td>
      <td>4</td>
      <td>2</td>
    </tr>
    <tr>
      <td><code class="language-plaintext highlighter-rouge">timestamps_unix_nano</code></td>
      <td>5</td>
      <td>5</td>
    </tr>
  </tbody>
</table>

<p>So:</p>

<ul>
  <li>In trunk, <code class="language-plaintext highlighter-rouge">attribute_indices</code> = <strong>2</strong></li>
  <li>In the Go module, <code class="language-plaintext highlighter-rouge">values</code> = <strong>2</strong>, <code class="language-plaintext highlighter-rouge">attribute_indices</code> = <strong>3</strong></li>
</ul>

<p>Someone reshuffled the field numbers between commits.<br />
The Go module was pegged to an <strong>older layout</strong>, while trunk had a newer one.</p>

<p>We had implemented against <strong>trunk</strong>.<br />
<code class="language-plaintext highlighter-rouge">profcheck</code> was compiled against the <strong>Go module</strong>.</p>

<p>Result:</p>

<ul>
  <li>
    <p>We wrote:</p>

    <ul>
      <li>Field <strong>2</strong> → <code class="language-plaintext highlighter-rouge">attribute_indices</code></li>
      <li>Field <strong>3</strong> → <code class="language-plaintext highlighter-rouge">link_index</code></li>
      <li>Field <strong>4</strong> → <code class="language-plaintext highlighter-rouge">values</code></li>
    </ul>
  </li>
  <li>
    <p><code class="language-plaintext highlighter-rouge">profcheck</code> decoded:</p>

    <ul>
      <li>Field <strong>2</strong> → <code class="language-plaintext highlighter-rouge">values</code></li>
      <li>Field <strong>3</strong> → <code class="language-plaintext highlighter-rouge">attribute_indices</code></li>
      <li>Field <strong>4</strong> → <code class="language-plaintext highlighter-rouge">link_index</code></li>
    </ul>
  </li>
</ul>

<p>So from <code class="language-plaintext highlighter-rouge">profcheck</code>’s point of view:</p>

<ul>
  <li>Our <code class="language-plaintext highlighter-rouge">link_index</code> staircase (2, 3, 4, …, 101) appeared in <strong>its</strong> <code class="language-plaintext highlighter-rouge">attribute_indices</code> field</li>
  <li>It checked those against an attribute table of size <strong>2</strong></li>
  <li>And fairly yelled: “index 101 is out of range [0..2).`</li>
</ul>

<p>Both sides were internally consistent.<br />
They just didn’t agree on the meaning of <strong>field number 2+</strong>.</p>

<hr />

<h2 id="6-the-real-root-cause">6. The Real Root Cause</h2>

<p>The core issue was:</p>

<blockquote>
  <p>The proto definition in the <strong>Go module</strong> used by <code class="language-plaintext highlighter-rouge">profcheck</code> did not match the <strong>trunk</strong> version in the GitHub repo.<br />
The Go module was pinned to an <strong>older commit</strong> where the field numbering was different.</p>
</blockquote>

<p>Thus:</p>

<ul>
  <li>Our encoding:
    <ul>
      <li>Correct for <strong>trunk</strong> schema</li>
      <li>Verified by <code class="language-plaintext highlighter-rouge">protoc</code> using that schema</li>
    </ul>
  </li>
  <li>Profcheck’s decoding:
    <ul>
      <li>Based on an <strong>older schema</strong></li>
      <li>Interpreted our tags with its own field map</li>
      <li>Misread <code class="language-plaintext highlighter-rouge">link_index</code> as <code class="language-plaintext highlighter-rouge">attribute_indices</code></li>
    </ul>
  </li>
</ul>

<p>No exotic protobuf edge case.<br />
No subtle encoder bug.<br />
Just plain schema drift masquerading as “validation errors.”</p>

<hr />

<h2 id="7-the-fix-align-with-profchecks-schema">7. The Fix: Align with Profcheck’s Schema</h2>

<p>From a practical standpoint, we had two options:</p>

<ol>
  <li>Fight <code class="language-plaintext highlighter-rouge">profcheck</code> and enforce trunk schema everywhere</li>
  <li>Align our field numbering with the schema that the ecosystem is actually using right now (the Go module)</li>
</ol>

<p>We chose option 2. The code change was almost embarrassingly simple:</p>

<div class="language-java highlighter-rouge"><div class="highlight"><pre class="highlight"><code><span class="c1">// Sample fields</span>
<span class="kd">public</span> <span class="kd">static</span> <span class="kd">final</span> <span class="kd">class</span> <span class="nc">Sample</span> <span class="o">{</span>
  <span class="kd">public</span> <span class="kd">static</span> <span class="kd">final</span> <span class="kt">int</span> <span class="no">STACK_INDEX</span> <span class="o">=</span> <span class="mi">1</span><span class="o">;</span>
  <span class="kd">public</span> <span class="kd">static</span> <span class="kd">final</span> <span class="kt">int</span> <span class="no">VALUES</span> <span class="o">=</span> <span class="mi">2</span><span class="o">;</span>               <span class="c1">// Was 4</span>
  <span class="kd">public</span> <span class="kd">static</span> <span class="kd">final</span> <span class="kt">int</span> <span class="no">ATTRIBUTE_INDICES</span> <span class="o">=</span> <span class="mi">3</span><span class="o">;</span>    <span class="c1">// Was 2</span>
  <span class="kd">public</span> <span class="kd">static</span> <span class="kd">final</span> <span class="kt">int</span> <span class="no">LINK_INDEX</span> <span class="o">=</span> <span class="mi">4</span><span class="o">;</span>           <span class="c1">// Was 3</span>
  <span class="kd">public</span> <span class="kd">static</span> <span class="kd">final</span> <span class="kt">int</span> <span class="no">TIMESTAMPS_UNIX_NANO</span> <span class="o">=</span> <span class="mi">5</span><span class="o">;</span> <span class="c1">// Unchanged</span>

  <span class="kd">private</span> <span class="nf">Sample</span><span class="o">()</span> <span class="o">{}</span>
<span class="o">}</span>
</code></pre></div></div>

<p>After that:</p>

<ul>
  <li>Our encoder wrote field numbers matching the <strong>Go module layout</strong></li>
  <li><code class="language-plaintext highlighter-rouge">profcheck</code> and <code class="language-plaintext highlighter-rouge">protoc</code> both interpreted the payload consistently</li>
</ul>

<h3 id="71-validation-after-the-change">7.1. Validation After the Change</h3>

<p>We re-ran our checks:</p>

<div class="language-bash highlighter-rouge"><div class="highlight"><pre class="highlight"><code><span class="c"># Canonical validation</span>
protoc <span class="nt">--decode</span><span class="o">=</span>opentelemetry.proto.profiles.v1development.ProfilesData <span class="se">\</span>
    <span class="nt">--proto_path</span><span class="o">=</span><span class="nb">.</span> <span class="se">\</span>
    opentelemetry/proto/profiles/v1development/profiles.proto <span class="se">\</span>
    &lt; profile.pb

<span class="c"># Ecosystem validation</span>
profcheck profile.pb
</code></pre></div></div>

<p>Results:</p>

<ul>
  <li><code class="language-plaintext highlighter-rouge">protoc</code> → ✅</li>
  <li><code class="language-plaintext highlighter-rouge">profcheck</code> → ✅</li>
</ul>

<p>The only remaining <code class="language-plaintext highlighter-rouge">profcheck</code> warnings were about timestamp ranges in synthetic test data, i.e. <strong>not</strong> protocol issues.</p>

<p>The mystery staircase of <code class="language-plaintext highlighter-rouge">attribute_indices</code> was gone. The logs looked calmer. Outside was still damp and miserable, but at least the protobuf wasn’t.</p>

<hr />

<h2 id="8-dual-validation-setup-with-docker">8. Dual Validation Setup (With Docker)</h2>

<p>To avoid “works on my machine” in the future, we containerized the validation environment.</p>

<div class="language-dockerfile highlighter-rouge"><div class="highlight"><pre class="highlight"><code><span class="k">FROM</span><span class="w"> </span><span class="s">golang:1.23-alpine</span><span class="w"> </span><span class="k">AS</span><span class="w"> </span><span class="s">builder</span>
<span class="c"># Build profcheck from OpenTelemetry sig-profiling repo</span>
<span class="k">RUN </span>git clone https://github.com/open-telemetry/sig-profiling.git
<span class="k">WORKDIR</span><span class="s"> /build/sig-profiling/tools/profcheck</span>
<span class="k">RUN </span>go build <span class="nt">-o</span> /profcheck .

<span class="k">FROM</span><span class="s"> alpine:latest</span>
<span class="k">RUN </span>apk add <span class="nt">--no-cache</span> protobuf protobuf-dev git

<span class="k">WORKDIR</span><span class="s"> /proto</span>
<span class="k">RUN </span>git clone <span class="nt">--depth</span><span class="o">=</span>1 https://github.com/open-telemetry/opentelemetry-proto.git

<span class="k">COPY</span><span class="s"> --from=builder /profcheck /usr/local/bin/profcheck</span>

<span class="k">RUN </span><span class="nb">cat</span> <span class="o">&gt;</span> /usr/local/bin/validate-profile <span class="o">&lt;&lt;</span> <span class="sh">'</span><span class="no">EOF</span><span class="sh">'</span>
<span class="c">#!/bin/sh</span>
set -e

PROFILE_FILE="$1"

if [ -z "$PROFILE_FILE" ]; then
  echo "Usage: validate-profile &lt;profile.pb&gt;" &gt;&amp;2
  exit 1
fi

echo "=== protoc decode ==="
protoc --decode=opentelemetry.proto.profiles.v1development.ProfilesData \
    --proto_path=/proto/opentelemetry-proto \
    opentelemetry/proto/profiles/v1development/profiles.proto \
    &lt; "$PROFILE_FILE" &gt; /tmp/decoded.txt

echo "Decoded profile written to /tmp/decoded.txt"

echo
echo "=== profcheck ==="
profcheck "$PROFILE_FILE"
EOF

<span class="k">RUN </span><span class="nb">chmod</span> +x /usr/local/bin/validate-profile
</code></pre></div></div>

<p>With this image:</p>

<ul>
  <li>Everyone in the team validates profiles with <strong>the same</strong>:
    <ul>
      <li><code class="language-plaintext highlighter-rouge">profcheck</code> build</li>
      <li><code class="language-plaintext highlighter-rouge">protoc</code> version</li>
      <li>OTLP proto checkout</li>
    </ul>
  </li>
</ul>

<p>CI uses it, local dev can use it, and nobody has to guess which version of which proto they’re really talking to.</p>

<hr />

<h2 id="9-practical-takeaways">9. Practical Takeaways</h2>

<h3 id="91-spec-compliant-needs-a-commit-hash">9.1. “Spec-Compliant” Needs a Commit Hash</h3>

<p>It’s not enough to say:</p>

<blockquote>
  <p>“We follow the OTLP profiles proto.”</p>
</blockquote>

<p>You must also know:</p>

<ul>
  <li><strong>Which commit</strong> of that proto you follow</li>
  <li>Which commit your tools (Go modules, profcheck, agents, exporters) are generated from</li>
</ul>

<p>Two schemas with the same package and message names but different field numbers are a silent disaster.</p>

<h3 id="92-protoc-is-necessary-not-sufficient">9.2. Protoc Is Necessary, Not Sufficient</h3>

<p><code class="language-plaintext highlighter-rouge">protoc</code> tells you:</p>

<blockquote>
  <p>“This payload is valid for the proto you gave me.”</p>
</blockquote>

<p>It does <strong>not</strong> guarantee:</p>

<ul>
  <li>That this proto matches what <code class="language-plaintext highlighter-rouge">profcheck</code> was generated from</li>
  <li>That your Go/Java/Python modules are in sync with your <code class="language-plaintext highlighter-rouge">.proto</code> checkout</li>
</ul>

<p>Think of <code class="language-plaintext highlighter-rouge">protoc</code> as the <strong>local judge</strong>, not the whole court.</p>

<h3 id="93-hex-dumps-still-matter">9.3. Hex Dumps Still Matter</h3>

<p>Hex dumps and manual decoding are tedious, but they:</p>

<ul>
  <li>Prove which field numbers are actually on the wire</li>
  <li>Show whether you’re emitting packed vs. non-packed fields correctly</li>
  <li>Help you spot “incrementing values in the wrong field” patterns</li>
</ul>

<p>When you’re stuck on a cold night, it’s basically looking for footprints in a snowstorm.</p>

<h3 id="94-stale-everything-files-and-schemas">9.4. Stale Everything: Files <em>and</em> Schemas</h3>

<p>Two equally annoying forms of “you’re staring at the wrong thing”:</p>

<ul>
  <li>Old <code class="language-plaintext highlighter-rouge">.pb</code> artifacts from earlier builds</li>
  <li>Old proto versions baked into dependencies and tools</li>
</ul>

<p>You have to invalidate both before you trust any conclusion.</p>

<h3 id="95-incrementing-values-in-a-constant-field--schema-mismatch-alarm">9.5. Incrementing Values in a “Constant” Field = Schema Mismatch Alarm</h3>

<p>If you expect:</p>

<ul>
  <li><code class="language-plaintext highlighter-rouge">attribute_indices = [1]</code> for all samples</li>
</ul>

<p>but you see:</p>

<ul>
  <li><code class="language-plaintext highlighter-rouge">2, 3, 4, …, 101</code></li>
</ul>

<p>assume:</p>

<ul>
  <li>You are probably decoding the wrong field under the wrong schema, not just “off by one.”</li>
</ul>

<hr />

<h2 id="10-debugging-checklist-for-protobuf-weirdness">10. Debugging Checklist for Protobuf Weirdness</h2>

<p>If you find yourself debugging protobuf in a winter mood, use this checklist:</p>

<ol>
  <li><strong>Verify internal data</strong>
    <ul>
      <li>Log tables, sizes, indices, actual arrays</li>
    </ul>
  </li>
  <li><strong>Validate with <code class="language-plaintext highlighter-rouge">protoc</code></strong>
    <ul>
      <li>Against the <code class="language-plaintext highlighter-rouge">.proto</code> you <em>think</em> you’re implementing</li>
    </ul>
  </li>
  <li><strong>Inspect the wire</strong>
    <ul>
      <li>Hex dump</li>
      <li>Decode tags: <code class="language-plaintext highlighter-rouge">tag = (field_number &lt;&lt; 3) | wire_type</code></li>
    </ul>
  </li>
  <li><strong>Compare schemas</strong>
    <ul>
      <li>GitHub trunk <code class="language-plaintext highlighter-rouge">.proto</code></li>
      <li>Vendored <code class="language-plaintext highlighter-rouge">.proto</code> in your repo</li>
      <li>Generated code (Go/Java/etc.)</li>
    </ul>
  </li>
  <li><strong>Check tool versions</strong>
    <ul>
      <li>Which commit is <code class="language-plaintext highlighter-rouge">profcheck</code> (or other validators) built from?</li>
    </ul>
  </li>
  <li><strong>Look at value patterns</strong>
    <ul>
      <li>Incrementing sequences</li>
      <li>Constant offsets</li>
      <li>Suspicious repetition</li>
    </ul>
  </li>
  <li><strong>Regenerate everything</strong>
    <ul>
      <li>Delete old <code class="language-plaintext highlighter-rouge">.pb</code> files</li>
      <li>Clean &amp; rebuild</li>
    </ul>
  </li>
  <li><strong>Assume version skew first</strong>
    <ul>
      <li>Before blaming protobuf</li>
      <li>Before blaming the cat</li>
      <li>Before rewriting your encoder twice</li>
    </ul>
  </li>
</ol>

<hr />

<h2 id="11-postmortem-what-actually-happened">11. Postmortem: What Actually Happened</h2>

<ul>
  <li>The OTLP profiles proto evolved; field numbers were rearranged in <code class="language-plaintext highlighter-rouge">Sample</code></li>
  <li>The <strong>Go module</strong> used by <code class="language-plaintext highlighter-rouge">profcheck</code> was locked to an <strong>older commit</strong></li>
  <li>We implemented using the <strong>trunk</strong> proto layout</li>
  <li>Our encoder wrote tags according to trunk</li>
  <li><code class="language-plaintext highlighter-rouge">profcheck</code> decoded tags according to the older Go module layout</li>
  <li>Our <code class="language-plaintext highlighter-rouge">link_index</code> became <code class="language-plaintext highlighter-rouge">attribute_indices</code> in <code class="language-plaintext highlighter-rouge">profcheck</code>’s view</li>
  <li><code class="language-plaintext highlighter-rouge">profcheck</code> legitimately complained about “index 101 out of range [0..2)”</li>
</ul>

<p>The fix:</p>

<ul>
  <li>Update four constants in <code class="language-plaintext highlighter-rouge">OtlpProtoFields.Sample</code> to match the Go module’s field numbering</li>
</ul>

<p>The lesson:</p>

<ul>
  <li>When two validators disagree on a cold, wet night, <strong>suspect schema version skew first</strong></li>
  <li>And always verify which reality your tools are compiled against</li>
</ul>

<p>The cat, for the record, was right to stay on the radiator the entire time.</p>]]></content><author><name></name></author><category term="profiling" /><category term="otlp" /><category term="protobuf" /><category term="debugging" /><category term="opentelemetry" /><category term="protobuf" /><category term="otlp" /><category term="profiling" /><category term="debugging" /><category term="go" /><category term="java" /><summary type="html"><![CDATA[This is the story of how a handful of integers managed to gaslight three separate tools, a Docker container, one human, and a very unimpressed cat on a radiator, while rain hammered the windows and the logs scrolled by like sleet.]]></summary></entry><entry><title type="html">Github Actions Permission Nightmare</title><link href="/posts/github-actions-blues" rel="alternate" type="text/html" title="Github Actions Permission Nightmare" /><published>2025-07-25T22:00:00+00:00</published><updated>2025-07-25T22:00:00+00:00</updated><id>/posts/github-actions-blues</id><content type="html" xml:base="/posts/github-actions-blues"><![CDATA[<h1 id="the-github-actions-permission-nightmare-a-journey-through-documentation-hell">The GitHub Actions Permission Nightmare: A Journey Through Documentation Hell</h1>

<p><em>Or: How I Spent Hours Building a Sophisticated Solution to Automate Clicking a Button (Spoiler: It Still Doesn’t Work)</em></p>

<h2 id="the-innocent-beginning">The Innocent Beginning</h2>

<p>It started with such a simple request: “Help me auto-sync my fork with its upstream.” How hard could it be? Just fetch upstream changes, create a branch, push it, and open a PR. Five minutes, tops.</p>

<p><em>Narrator: It was not five minutes.</em></p>

<h2 id="act-i-the-schema-validation-betrayal">Act I: The Schema Validation Betrayal</h2>

<p>I confidently started with what seemed like reasonable permissions:</p>

<div class="language-yaml highlighter-rouge"><div class="highlight"><pre class="highlight"><code><span class="na">permissions</span><span class="pi">:</span>
  <span class="na">contents</span><span class="pi">:</span> <span class="s">write</span>      <span class="c1"># push the sync branch</span>
  <span class="na">pull-requests</span><span class="pi">:</span> <span class="s">write</span> <span class="c1"># open, approve &amp; merge the PR</span>
  <span class="na">workflows</span><span class="pi">:</span> <span class="s">write</span>     <span class="c1"># enable auto-merge</span>
</code></pre></div></div>

<p>GitHub’s schema validator immediately slapped me with:</p>

<div class="language-plaintext highlighter-rouge"><div class="highlight"><pre class="highlight"><code>Schema validation: Property 'workflows' is not allowed
</code></pre></div></div>

<p>“Ah,” I thought, “clearly <code class="language-plaintext highlighter-rouge">workflows</code> isn’t a valid permission. Let me just remove that invalid line.”</p>

<p><em>Famous last words.</em></p>

<h2 id="act-ii-the-runtime-reality-check">Act II: The Runtime Reality Check</h2>

<p>With the “invalid” permission removed, the workflow passed validation but failed spectacularly at runtime:</p>

<div class="language-plaintext highlighter-rouge"><div class="highlight"><pre class="highlight"><code>! [remote rejected] upstream-sync -&gt; upstream-sync 
(refusing to allow a GitHub App to create or update workflow 
`.github/workflows/main.yml` without `workflows` permission)
</code></pre></div></div>

<p>Wait, WHAT? The error message is literally asking for the <code class="language-plaintext highlighter-rouge">workflows</code> permission that the schema validator just told me doesn’t exist.</p>

<p>This is like being told you need a driver’s license to drive, but also being told that driver’s licenses are a myth.</p>

<h2 id="act-iii-the-documentation-rabbit-hole">Act III: The Documentation Rabbit Hole</h2>

<p>Surely GitHub’s documentation would clear this up. I dove into their official docs, searching for the definitive list of valid permissions. What I found was:</p>

<ul>
  <li>🔍 Multiple documentation pages with different information</li>
  <li>📝 Some pages mentioning <code class="language-plaintext highlighter-rouge">actions: write</code> for workflow-related operations</li>
  <li>📋 Other pages showing examples with permissions that don’t match the schema</li>
  <li>🤷 Zero consistency between schema validation and runtime behavior</li>
</ul>

<p>I tried <code class="language-plaintext highlighter-rouge">actions: write</code> instead. Same error. The runtime system was still demanding the mythical <code class="language-plaintext highlighter-rouge">workflows</code> permission like a bouncer asking for a membership card to a club that doesn’t exist.</p>

<h2 id="act-iv-the-catch-22">Act IV: The Catch-22</h2>

<p>At this point, I was trapped in a perfect catch-22:</p>

<ul>
  <li><strong>Schema validation</strong>: “You cannot use <code class="language-plaintext highlighter-rouge">workflows: write</code> - it doesn’t exist!”</li>
  <li><strong>Runtime system</strong>: “You must use <code class="language-plaintext highlighter-rouge">workflows</code> permission to modify workflow files!”</li>
  <li><strong>Documentation</strong>: “¯\<em>(ツ)</em>/¯”</li>
</ul>

<p>I tried adding <code class="language-plaintext highlighter-rouge">workflows: write</code> back, thinking maybe the schema validator was wrong. Result: Back to the original schema validation error.</p>

<p>It’s like GitHub’s left hand doesn’t know what its right hand is doing, and both hands are actively fighting each other while flipping you off.</p>

<h2 id="act-v-the-cli-comedy-of-errors">Act V: The CLI Comedy of Errors</h2>

<p>“Fine,” I said, “I’ll use GitHub CLI instead of those problematic actions.”</p>

<p>First attempt:</p>
<div class="language-bash highlighter-rouge"><div class="highlight"><pre class="highlight"><code>gh <span class="nb">pr </span>create <span class="nt">--json</span> number
</code></pre></div></div>
<div class="language-plaintext highlighter-rouge"><div class="highlight"><pre class="highlight"><code>unknown flag: --json
</code></pre></div></div>

<p>The GitHub Actions runner had an older version of <code class="language-plaintext highlighter-rouge">gh</code> that didn’t support modern flags. Because of course it did.</p>

<p>Second attempt (simplified):</p>
<div class="language-bash highlighter-rouge"><div class="highlight"><pre class="highlight"><code>gh <span class="nb">pr </span>create <span class="nt">--head</span> upstream-sync <span class="nt">--base</span> master
</code></pre></div></div>
<div class="language-plaintext highlighter-rouge"><div class="highlight"><pre class="highlight"><code>pull request create failed: GraphQL: Resource not accessible by integration (createPullRequest)
</code></pre></div></div>

<p>Apparently, the <code class="language-plaintext highlighter-rouge">GITHUB_TOKEN</code> doesn’t have GraphQL permissions for <code class="language-plaintext highlighter-rouge">createPullRequest</code>. Because why would the token designed for GitHub Actions be able to… create pull requests in GitHub Actions?</p>

<h2 id="act-vi-the-api-expedition">Act VI: The API Expedition</h2>

<p>“Screw it,” I declared, “I’ll use the REST API directly!”</p>

<div class="language-bash highlighter-rouge"><div class="highlight"><pre class="highlight"><code>curl <span class="nt">-X</span> POST <span class="s2">"https://api.github.com/repos/user/repo/pulls"</span> <span class="se">\</span>
  <span class="nt">-d</span> <span class="s1">'{"title": "Automated upstream merge", "head": "upstream-sync", "base": "master"}'</span>
</code></pre></div></div>

<p>Response:</p>
<div class="language-json highlighter-rouge"><div class="highlight"><pre class="highlight"><code><span class="p">{</span><span class="w">
  </span><span class="nl">"message"</span><span class="p">:</span><span class="w"> </span><span class="s2">"GitHub Actions is not permitted to create or approve pull requests."</span><span class="p">,</span><span class="w">
  </span><span class="nl">"status"</span><span class="p">:</span><span class="w"> </span><span class="s2">"403"</span><span class="w">
</span><span class="p">}</span><span class="w">
</span></code></pre></div></div>

<p>Ah, the plot thickens! There’s a <strong>repository-level setting</strong> called “Allow GitHub Actions to create and approve pull requests” that was disabled. This is a security setting that prevents automated PR creation.</p>

<p>After enabling this setting, the API finally worked! 🎉</p>

<h2 id="act-vii-the-self-approval-scandal">Act VII: The Self-Approval Scandal</h2>

<p>Success! The PR was created automatically. Now for the auto-approval…</p>

<div class="language-json highlighter-rouge"><div class="highlight"><pre class="highlight"><code><span class="p">{</span><span class="w">
  </span><span class="nl">"message"</span><span class="p">:</span><span class="w"> </span><span class="s2">"Unprocessable Entity"</span><span class="p">,</span><span class="w">
  </span><span class="nl">"errors"</span><span class="p">:</span><span class="w"> </span><span class="p">[</span><span class="s2">"Can not approve your own pull request"</span><span class="p">],</span><span class="w">
  </span><span class="nl">"status"</span><span class="p">:</span><span class="w"> </span><span class="s2">"422"</span><span class="w">
</span><span class="p">}</span><span class="w">
</span></code></pre></div></div>

<p>Of course. GitHub doesn’t allow you to approve your own PRs. This is actually good security practice, but it means true automation is impossible.</p>

<h2 id="act-viii-the-branch-protection-plot-twist">Act VIII: The Branch Protection Plot Twist</h2>

<p>“Fine,” I said, “I’ll just merge the changes directly to master and skip the PR entirely!”</p>

<div class="language-bash highlighter-rouge"><div class="highlight"><pre class="highlight"><code>git push origin master
</code></pre></div></div>
<div class="language-plaintext highlighter-rouge"><div class="highlight"><pre class="highlight"><code>! [remote rejected] master -&gt; master (protected branch hook declined)
</code></pre></div></div>

<p>Organization branch protection rules prevent direct pushes to master. Because we’re in an enterprise environment where security policies actually matter.</p>

<h2 id="the-bitter-end-a-sophisticated-solution-to-nothing">The Bitter End: A Sophisticated Solution to Nothing</h2>

<p>After hours of troubleshooting through GitHub’s permission maze, I had built a technically perfect workflow that:</p>

<p>✅ <strong>Successfully syncs upstream changes</strong> while preserving local workflow files<br />
✅ <strong>Automatically creates well-formatted PRs</strong> with clear descriptions<br />
✅ <strong>Enables auto-merge</strong> so PRs merge immediately after approval<br />
✅ <strong>Handles edge cases</strong> and provides comprehensive error handling<br />
❌ <strong>Still requires manual approval</strong> due to organizational branch protection rules<br />
❌ <strong>Provides zero practical benefit</strong> over clicking “Sync fork” in the GitHub UI</p>

<h2 id="the-lessons-learned">The Lessons Learned</h2>

<ol>
  <li>
    <p><strong>GitHub’s tooling is inconsistent</strong>: Schema validation and runtime behavior can directly contradict each other.</p>
  </li>
  <li>
    <p><strong>Error messages lie</strong>: When GitHub says you need “workflows permission,” it might mean something that doesn’t actually exist in the schema.</p>
  </li>
  <li>
    <p><strong>Documentation is unreliable</strong>: Multiple official sources can give conflicting information about the same feature.</p>
  </li>
  <li>
    <p><strong>Enterprise constraints trump clever solutions</strong>: No amount of technical sophistication can bypass organizational security policies.</p>
  </li>
  <li>
    <p><strong>Sometimes the simple solution is the right solution</strong>: Clicking a button in the UI might actually be more efficient than building a complex automation that doesn’t automate the painful parts.</p>
  </li>
  <li>
    <p><strong>Policy problems require policy solutions</strong>: The real blocker wasn’t technical - it was organizational rules that prevent true automation.</p>
  </li>
</ol>

<h2 id="the-final-irony">The Final Irony</h2>

<p>The original problem was having to manually sync multiple forks daily by clicking through the GitHub UI. After hours of sophisticated engineering, I built a system that… still requires manually clicking through GitHub to approve PRs.</p>

<p>In the end, I automated everything except the part that actually needed automation.</p>

<h2 id="the-real-takeaway">The Real Takeaway</h2>

<p>This experience perfectly illustrates the difference between <strong>technical possibility</strong> and <strong>practical value</strong>. Just because you <em>can</em> build something doesn’t mean you <em>should</em>. Sometimes the boring, manual solution is actually the right one - especially when organizational constraints make true automation impossible.</p>

<p>The GitHub “Sync fork” button exists for a reason. It’s simple, reliable, and achieves the same end result with the same amount of manual intervention as our sophisticated workflow.</p>

<p>Sometimes the real automation is the clicking I did along the way. 🤷‍♂️</p>

<hr />

<p><em>P.S. - If you’re facing similar GitHub Actions permission issues, save yourself some time: check your repository settings first, accept that organizational policies exist for a reason, and don’t be afraid to embrace the simple solution. Your sanity will thank you.</em></p>

<h2 id="technical-appendix">Technical Appendix</h2>

<p>For those brave souls who want to see the final working (but practically useless) workflow:</p>

<div class="language-yaml highlighter-rouge"><div class="highlight"><pre class="highlight"><code><span class="na">name</span><span class="pi">:</span> <span class="s">Upstream-sync → protected master</span>
<span class="na">on</span><span class="pi">:</span>
  <span class="na">schedule</span><span class="pi">:</span>            <span class="c1"># run every night</span>
    <span class="pi">-</span> <span class="na">cron</span><span class="pi">:</span>  <span class="s1">'</span><span class="s">7</span><span class="nv"> </span><span class="s">2</span><span class="nv"> </span><span class="s">*</span><span class="nv"> </span><span class="s">*</span><span class="nv"> </span><span class="s">*'</span>
  <span class="na">workflow_dispatch</span><span class="pi">:</span>   <span class="c1"># (optional) manual trigger</span>

<span class="na">permissions</span><span class="pi">:</span>           <span class="c1"># minimum perms the job needs</span>
  <span class="na">contents</span><span class="pi">:</span> <span class="s">write</span>      <span class="c1"># push the sync branch</span>
  <span class="na">pull-requests</span><span class="pi">:</span> <span class="s">write</span> <span class="c1"># open, approve &amp; merge the PR</span>

<span class="na">concurrency</span><span class="pi">:</span>           <span class="c1"># never let two syncs race</span>
  <span class="na">group</span><span class="pi">:</span> <span class="s">$-$</span>
  <span class="na">cancel-in-progress</span><span class="pi">:</span> <span class="no">true</span>

<span class="na">jobs</span><span class="pi">:</span>
  <span class="na">sync</span><span class="pi">:</span>
    <span class="na">runs-on</span><span class="pi">:</span> <span class="s">ubuntu-latest</span>

    <span class="na">steps</span><span class="pi">:</span>
      <span class="c1"># 1. full clone so we always have the latest tip</span>
      <span class="pi">-</span> <span class="na">uses</span><span class="pi">:</span> <span class="s">actions/checkout@v4</span>
        <span class="na">with</span><span class="pi">:</span>
          <span class="na">fetch-depth</span><span class="pi">:</span> <span class="m">0</span>
          <span class="na">token</span><span class="pi">:</span> <span class="s">$</span>

      <span class="c1"># 2. fetch upstream &amp; copy it to a side branch</span>
      <span class="pi">-</span> <span class="na">name</span><span class="pi">:</span> <span class="s">Update upstream-sync branch</span>
        <span class="na">env</span><span class="pi">:</span>
          <span class="na">GITHUB_TOKEN</span><span class="pi">:</span> <span class="s">$</span>
        <span class="na">run</span><span class="pi">:</span> <span class="pi">|</span>
          <span class="s"># Configure git identity</span>
          <span class="s">git config --global user.email "action@github.com"</span>
          <span class="s">git config --global user.name "GitHub Action"</span>
          
          <span class="s">git remote add upstream https://github.com/openjdk/jdk.git</span>
          <span class="s">git fetch upstream master</span>
          
          <span class="s"># Create sync branch from current master to preserve workflows</span>
          <span class="s">git checkout -B upstream-sync origin/master</span>
          
          <span class="s"># Simple merge approach - let's see what happens</span>
          <span class="s">if git merge upstream/master --no-edit --allow-unrelated-histories; then</span>
            <span class="s">echo "=== Merge successful ==="</span>
            <span class="s">git log --oneline -5</span>
          <span class="s">else</span>
            <span class="s">echo "=== Merge failed, trying alternative approach ==="</span>
            <span class="s">git merge --abort || true</span>
            <span class="s">git reset --hard upstream/master</span>
            <span class="s"># Restore our workflow files after taking upstream</span>
            <span class="s">git checkout origin/master -- .github/workflows/</span>
            <span class="s">git add .github/workflows/</span>
            <span class="s">git commit -m "Preserve local workflow files during upstream sync"</span>
            <span class="s">echo "=== Alternative approach completed ==="</span>
            <span class="s">git log --oneline -5</span>
          <span class="s">fi</span>
          
          <span class="s">git push -f origin upstream-sync</span>

      <span class="c1"># 3. Create PR and attempt auto-merge (constrained by org branch protection)</span>
      <span class="pi">-</span> <span class="na">name</span><span class="pi">:</span> <span class="s">Create PR for upstream sync</span>
        <span class="na">env</span><span class="pi">:</span>
          <span class="na">GITHUB_TOKEN</span><span class="pi">:</span> <span class="s">$</span>
        <span class="na">run</span><span class="pi">:</span> <span class="pi">|</span>
          <span class="s"># Check if PR already exists</span>
          <span class="s">PR_EXISTS=$(curl -s -H "Authorization: token $GITHUB_TOKEN" \</span>
            <span class="s">"https://api.github.com/repos/$/pulls?head=$:upstream-sync&amp;base=master" \</span>
            <span class="s">| jq -r '.[0].number // empty')</span>
          
          <span class="s">if [ -n "$PR_EXISTS" ]; then</span>
            <span class="s">echo "PR #$PR_EXISTS already exists - updating it"</span>
            <span class="s">curl -s -X PATCH -H "Authorization: token $GITHUB_TOKEN" \</span>
              <span class="s">-H "Accept: application/vnd.github.v3+json" \</span>
              <span class="s">"https://api.github.com/repos/$/pulls/$PR_EXISTS" \</span>
              <span class="s">-d '{</span>
                <span class="s">"title": "🤖 Automated upstream sync",</span>
                <span class="s">"body": "**Automated nightly sync of upstream changes**\n\n📊 **What this includes:**\n- Latest commits from `openjdk/jdk17u-dev:master`\n- Preserves local workflow configurations\n- Ready for immediate merge\n\n🔄 **Auto-generated by:** `.github/workflows/dd-sync.yml`\n\n⚡ **Action required:** Just click **Approve** to merge automatically!"</span>
              <span class="s">}'</span>
            <span class="s">echo "✅ Updated existing PR #$PR_EXISTS"</span>
          <span class="s">else</span>
            <span class="s">echo "Creating new PR for upstream sync"</span>
            <span class="s">PR_RESPONSE=$(curl -s -X POST -H "Authorization: token $GITHUB_TOKEN" \</span>
              <span class="s">-H "Accept: application/vnd.github.v3+json" \</span>
              <span class="s">"https://api.github.com/repos/$/pulls" \</span>
              <span class="s">-d '{</span>
                <span class="s">"title": "🤖 Automated upstream sync",</span>
                <span class="s">"body": "**Automated nightly sync of upstream changes**\n\n📊 **What this includes:**\n- Latest commits from `openjdk/jdk17u-dev:master`\n- Preserves local workflow configurations\n- Ready for immediate merge\n\n🔄 **Auto-generated by:** `.github/workflows/dd-sync.yml`\n\n⚡ **Action required:** Just click **Approve** to merge automatically!",</span>
                <span class="s">"head": "upstream-sync",</span>
                <span class="s">"base": "master"</span>
              <span class="s">}')</span>
            <span class="s">PR_NUMBER=$(echo "$PR_RESPONSE" | jq -r '.number')</span>
            <span class="s">if [ "$PR_NUMBER" != "null" ] &amp;&amp; [ -n "$PR_NUMBER" ]; then</span>
              <span class="s">echo "✅ Created PR #$PR_NUMBER"</span>
          <span class="no">    </span>
              <span class="s"># Enable auto-merge immediately</span>
              <span class="s">curl -s -X PUT -H "Authorization: token $GITHUB_TOKEN" \</span>
                <span class="s">-H "Accept: application/vnd.github+json" \</span>
                <span class="s">"https://api.github.com/repos/$/pulls/$PR_NUMBER/merge" \</span>
                <span class="s">-d '{"merge_method": "merge"}' &amp;&amp; echo "🚀 Auto-merge enabled" || echo "⚠️ Auto-merge requires approval"</span>
            <span class="s">else</span>
              <span class="s">echo "❌ Failed to create PR: $PR_RESPONSE"</span>
            <span class="s">fi</span>
          <span class="s">fi</span>
          
          <span class="s">echo ""</span>
          <span class="s">echo "🎯 **SUMMARY:** Upstream sync PR is ready!"</span>
          <span class="s">echo "📝 **Next step:** Approve the PR and it will merge automatically"</span>
          <span class="s">echo "🔗 **Link:** https://github.com/$/pulls"</span>
</code></pre></div></div>

<p>This workflow technically works perfectly. It just doesn’t solve the actual problem. 🎭</p>]]></content><author><name></name></author><category term="github" /><category term="openjdk" /><category term="ci" /><category term="github" /><category term="actions" /><category term="openjdk" /><summary type="html"><![CDATA[The GitHub Actions Permission Nightmare: A Journey Through Documentation Hell]]></summary></entry><entry><title type="html">A different shade of context</title><link href="/posts/different-shade-of-context" rel="alternate" type="text/html" title="A different shade of context" /><published>2024-04-26T07:00:00+00:00</published><updated>2024-04-26T07:00:00+00:00</updated><id>/posts/different-shade-of-context</id><content type="html" xml:base="/posts/different-shade-of-context"><![CDATA[<ol id="markdown-toc">
  <li><a href="#oh-not-again-" id="markdown-toc-oh-not-again-">Oh, not again …</a></li>
  <li><a href="#the-plot-twist" id="markdown-toc-the-plot-twist">The plot twist</a></li>
  <li><a href="#the-idea" id="markdown-toc-the-idea">The idea</a></li>
  <li><a href="#juicing-the-idea" id="markdown-toc-juicing-the-idea">Juicing the idea</a></li>
  <li><a href="#the-proposal" id="markdown-toc-the-proposal">The proposal</a></li>
  <li><a href="#whats-next" id="markdown-toc-whats-next">What’s next</a></li>
  <li><a href="#gnarly-details" id="markdown-toc-gnarly-details">Gnarly details</a>    <ol>
      <li><a href="#design" id="markdown-toc-design">Design</a>        <ol>
          <li><a href="#contextual-annotation" id="markdown-toc-contextual-annotation">Contextual annotation</a></li>
          <li><a href="#context-driven-behaviour" id="markdown-toc-context-driven-behaviour">Context driven behaviour</a>            <ol>
              <li><a href="#conditionally-emit-events" id="markdown-toc-conditionally-emit-events">Conditionally emit events</a></li>
              <li><a href="#record-only-activated-context" id="markdown-toc-record-only-activated-context">Record only activated context</a></li>
              <li><a href="#controlling-the-behaviour-via-settings" id="markdown-toc-controlling-the-behaviour-via-settings">Controlling the behaviour via settings</a></li>
            </ol>
          </li>
        </ol>
      </li>
      <li><a href="#implementation" id="markdown-toc-implementation">Implementation</a>        <ol>
          <li><a href="#contextual-annotation-1" id="markdown-toc-contextual-annotation-1"><code class="language-plaintext highlighter-rouge">@Contextual</code> annotation</a></li>
          <li><a href="#activated-context" id="markdown-toc-activated-context">Activated context</a></li>
        </ol>
      </li>
    </ol>
  </li>
</ol>

<h2 id="oh-not-again-">Oh, not again …</h2>
<p>Yes, you remember correctly. I did write a quite lengthy series of blog posts about my proposal
for <a href="/posts/seeing-in-context_1">JFR context implementation</a>. However, it turned
out that the proposed changes were too intrusive and would never be accepted.</p>

<p>Things looked bleak for a while, because without the context in JFR, we would still need to rely
on a separate JVMTI agent to do the cool things we can do, thanks to the context.</p>

<h2 id="the-plot-twist">The plot twist</h2>
<p>During my trip to Stockholm where my colleague <a href="https://richardstartin.github.io/">Richard Startin</a> and I talked
about <a href="https://www.youtube.com/watch?v=10L-7fb4SWk&amp;list=PLUQORQEatnJezysGP4J-EZm34u-OyILC2&amp;index=7">future-proofing the profiling support in the JVM</a>,
we also managed to secure a meeting with my former colleagues and, I dare say friends, <a href="https://inside.java/u/MarkusGronlund/">Markus Grönlund</a>
and <a href="https://inside.java/u/ErikGahlin/">Erik Gahlin</a>. They are the main force behind JFR and it made a lot of sense to meet them.</p>

<p>We ended up talking for many more hours than originally planned, and it was a very fruitful discussion. When trying to figure
out what to do with the context in JFR, Erik suddenly asked: “Why don’t we just have special events to convey the context?”.</p>

<h2 id="the-idea">The idea</h2>
<p>The idea was simple: we would introduce a new event meta type, <code class="language-plaintext highlighter-rouge">@Contextual</code>, which would be used to convey the context.</p>

<p>This idea is also pretty old and was originally dismissed because, in order to capture rapidly changing context, as would
be the case for async or reactive applications, we would need to generate a lot of events. And that would be a problem -
the recording size would blow up, and the transfer and processing costs would skyrocket.</p>

<p>Here, Markus and Erik stopped and asked - “Hm, but what if we emit the contextual event only when it applies to at least one
other event?”.</p>

<p>The word <em>“applies”</em> here translates to an event being committed between calls to <code class="language-plaintext highlighter-rouge">begin()</code> and <code class="language-plaintext highlighter-rouge">end()</code> methods
of the contextual event.</p>

<p>And sure, with this little tweak we would be able to attach an arbitrary context to virtually any JFR event. The number and types
of the context fields would be limited only by what the user will be willing to pay in terms of memory and storage
costs.</p>

<h2 id="juicing-the-idea">Juicing the idea</h2>
<p>What if we don’t stop there? If we have contextual events we could also use the presence of the context as an alternative
to the event threshold which is in use today. While thresholding allows focusing on the outliers, it is many times the
‘death by a hundred cuts’ that is the real problem. But in that case, thresholding would actually mask the real problem, as
the short-lived events would never cross the threshold and be reported.</p>

<p>But if, instead of checking the event duration to cross the threshold, we could check if there is a contextual event that applies to the event,
this would create a ‘magnifying glass’ effect, where all the fine details would be preserved as long as there is a context.
And, considering that the context is present for operations of special interest to the user, it would be a perfect match.</p>

<h2 id="the-proposal">The proposal</h2>
<p>Putting all of this together I set out creating an early <a href="https://github.com/openjdk/jdk/pull/18689">prototype of the contextual events</a>.
The prototype is still in the very PoC stage, but it already shows a lot of promise. I have patched the <a href="https://github.com/DataDog/dd-trace-java">Datadog Java tracer</a>
to turn the existing <code class="language-plaintext highlighter-rouge">TimelineEvent</code> type to a contextual event and ran a bunch of applications to see how it behaves.</p>

<p>And it does what is expected - the context is easily attributable to various events, like CPU, Wallclock, or Allocation samples, but not only that.
It is also possible to associate the context with built-in events like MonitorWait, etc.</p>

<p>In order to test the thresholding alternative, I set the threshold for <code class="language-plaintext highlighter-rouge">ThreadPark</code> and <code class="language-plaintext highlighter-rouge">JavaMonitorWait</code> events to 0ms (no threshold, and something you really don’t want to do in production).
The results were astonishing - the recording was not bloated, the processing was not overwhelmed, and the events were still there, providing the fine-grained details of the application’s behavior.</p>

<h2 id="whats-next">What’s next</h2>
<p>Currently, we are collecting feedback from the community and early adopters. So far, there hasn’t been much of the feedback,
but I am hoping that this blog post will change that.</p>

<p>If you have any thoughts, ideas, or concerns, please feel free to use
the <a href="https://github.com/openjdk/jdk/pull/18689">PR</a> to comment directly there. Or, if you prefer, you can leave a comment here.</p>

<hr />
<p><em>(This is a copy of the detailed description of the proposal from the PR - just for the record if the PR would change in future)</em></p>
<h2 id="gnarly-details">Gnarly details</h2>

<h3 id="design">Design</h3>

<h4 id="contextual-annotation">Contextual annotation</h4>

<p>A contextual event will be demarked by <code class="language-plaintext highlighter-rouge">@Contextual</code> annotation. This annotation wil be a simple indication
that this particular event type is supposed to provide context to other events and tooling can handle it as such.</p>

<p>All custom fields of such annotated event type will then constitute the context.</p>

<h4 id="context-driven-behaviour">Context driven behaviour</h4>

<p>Although having the <code class="language-plaintext highlighter-rouge">@Contextual</code> annotation will allow the tooling to associate the context with other
JFR events, there are more ways they can be utilized.</p>

<h6 id="conditionally-emit-events">Conditionally emit events</h6>

<p>The contextual events can be used to guard annotations of events which are too costly to emit unconditionally
and using the durational thresholds would introduce too strong bias. An example would be <code class="language-plaintext highlighter-rouge">JavaMonitorWait</code> event.</p>

<p>If left unchecked, the emission rate of <code class="language-plaintext highlighter-rouge">JavaMonitorEvent</code> can overwhelm the recording. What’s worse is that
the majority of the recorded events will provide very little additional information. Turning on the durational
threshold will improve the situation, but will introduce bias where the JFR will not be able to point out too much
time spent waiting on a lock, if each wait is shorter than the threshold. In addition to that, this event type
might be frequently emitted from thread pools where threads are just waiting for work.</p>

<p>If the emission is bound to the presence of a context (contextual event) which will be activated only when
an important work (what is important work will usually be defined by the user) is being done, providing laser
focus on fine-grained details of the application’s behaviour.</p>

<h6 id="record-only-activated-context">Record only activated context</h6>

<p>We are talking about an activated context (contextual event) when there is at least one other event committed
on the same thread between calling <code class="language-plaintext highlighter-rouge">begin()</code> and <code class="language-plaintext highlighter-rouge">end()</code> of the contextual thread. We can also think about
the context being ‘triggered’ by the regular events.</p>

<p>The concept of ‘active’ context is beneficial in lowering the overhead related to recording the context -
eg. for the distributed tracers with context propagation it is possible to generated millions of contextual
events per minute for certain frameworks (async and reactive ones are pretty notorious). This creates a huge
pressure both when the recording is written and also when it needs to be processed. And most of these events
will be literally useless because there would be no events the context could be applied to.</p>

<h5 id="controlling-the-behaviour-via-settings">Controlling the behaviour via settings</h5>

<p>The proposal is to use the standard JFR event settings mechanism to affect the behaviour of both
contextual and regular events.</p>

<p>There will be a new setting called <code class="language-plaintext highlighter-rouge">select</code> and the following permitted values:</p>
<ul>
  <li><code class="language-plaintext highlighter-rouge">if-context</code>   - the regular event will be emitted only if a context is present</li>
  <li><code class="language-plaintext highlighter-rouge">if-triggered</code> - the contextual event will be emitted only if the context is triggered</li>
  <li><code class="language-plaintext highlighter-rouge">all</code>          - no context related restrictions are applied</li>
</ul>

<p>The <code class="language-plaintext highlighter-rouge">if-context</code> option is valid only for non-contextual events.
The <code class="language-plaintext highlighter-rouge">if-triggered</code> option is valid only for contextual events.
The <code class="language-plaintext highlighter-rouge">all</code> option is valid for any event.</p>

<p>If an invalid option is provided, JFR will log a warning and the setting will be set to <code class="language-plaintext highlighter-rouge">all</code>.</p>

<p>The <code class="language-plaintext highlighter-rouge">select</code> setting is to be used in conjunction with other filtering mechanisms, like <code class="language-plaintext highlighter-rouge">threshold</code>.</p>

<h3 id="implementation">Implementation</h3>

<h4 id="contextual-annotation-1"><code class="language-plaintext highlighter-rouge">@Contextual</code> annotation</h4>

<p>The annotation implementation is pretty straightforward and there is nothing special going on there.</p>

<h4 id="activated-context">Activated context</h4>

<p>In order to support selective emission of the contextual events only when they are activated the event
class must be instrumented and a synthetic field named <code class="language-plaintext highlighter-rouge">^ctxOffset</code> must be inserted there.</p>

<p>The field is used to track the number of events written while this context is open. The actual number
does not matter, we just need to make sure we can tell there is at least one written event.</p>

<p>This information is then used in the <code class="language-plaintext highlighter-rouge">shouldCommit()</code> method of the contextual event type which needs
to be changed to consult <code class="language-plaintext highlighter-rouge">^ctxOffset</code> field and return false if that field is <code class="language-plaintext highlighter-rouge">0</code>. That is, if the
event’s settings contains <code class="language-plaintext highlighter-rouge">select=if-triggered</code>. Otherwise, the behaviour of <code class="language-plaintext highlighter-rouge">shouldCommit()</code> is not
affected.</p>

<p>The <code class="language-plaintext highlighter-rouge">^ctxOffset</code> field is updated from <code class="language-plaintext highlighter-rouge">EventWriter</code>, incrementing it on a new event commit.</p>]]></content><author><name></name></author><category term="java" /><category term="jvm" /><category term="openjdk" /><summary type="html"><![CDATA[]]></summary></entry><entry><title type="html">Dude, where’s my memory?!</title><link href="/posts/stop-that-leak" rel="alternate" type="text/html" title="Dude, where’s my memory?!" /><published>2024-04-17T08:00:00+00:00</published><updated>2024-04-17T08:00:00+00:00</updated><id>/posts/stop-that-leak</id><content type="html" xml:base="/posts/stop-that-leak"><![CDATA[<ol id="markdown-toc">
  <li><a href="#it-starts-with-a-customer-report" id="markdown-toc-it-starts-with-a-customer-report">It starts with a customer report</a></li>
  <li><a href="#reproducer" id="markdown-toc-reproducer">Reproducer</a></li>
  <li><a href="#the-investigation" id="markdown-toc-the-investigation">The investigation</a>    <ol>
      <li><a href="#native-memory-tracking" id="markdown-toc-native-memory-tracking">Native Memory Tracking</a></li>
      <li><a href="#asan" id="markdown-toc-asan">ASAN</a></li>
      <li><a href="#valgrind" id="markdown-toc-valgrind">Valgrind</a></li>
      <li><a href="#ddprof" id="markdown-toc-ddprof">DDPROF</a></li>
    </ol>
  </li>
  <li><a href="#and-they-lived-happily-ever-after" id="markdown-toc-and-they-lived-happily-ever-after">And they lived happily ever after</a></li>
  <li><a href="#conclusion" id="markdown-toc-conclusion">Conclusion</a></li>
</ol>

<h2 id="it-starts-with-a-customer-report">It starts with a customer report</h2>

<p>Recently, I received a report from a customer that they noticed RSS slowly growing over time in their application when
they enable <a href="https://github.com/DataDog/java-profiler">Datadog Java Profiler</a>. There is no unexpected growth in heap usage,
meaning that it is the native memory usage that is growing. Oh well, I should brace for a fun debugging session.</p>

<h2 id="reproducer">Reproducer</h2>

<p>Quite expectedly, the customer was not able to share their application with me, so I have to come up with a reproducer.
From the problem description there was nothing extraordinary with the application, yet our continuous reliability tests
did not catch the issue.
Usually, when I have no idea where to start, I reach out to the <a href="https://renaissance.dev/">Renaissance Benchmark</a> which
provides a nice collection of diverse load generating cases. As luck wanted it, the <a href="https://renaissance.dev/benchmarks/akka-uct/">Akka-uct</a>
benchmark was the first one I tried, and it exhibited the same behavior as the customer’s application. The RSS was growing
quite visible with the interpolated rate of 60-70MiB per day but the Java heap usage was rather stable.</p>

<h2 id="the-investigation">The investigation</h2>

<h3 id="native-memory-tracking">Native Memory Tracking</h3>

<p>The first thing I did was to enable the <a href="https://docs.oracle.com/javase/8/docs/technotes/guides/troubleshoot/tooldescr007.html">native memory tracking (NMT)</a>
and check the JVM native memory statistics. Unfortunately, the NMT did not show anything suspicious. The usage of the native
memory managed by JVM stayed stable, which was not the case with the RSS.</p>

<h3 id="asan">ASAN</h3>

<p>Ruling out the JVM managed native memory issues I refocused on our profiler library which is a native JVMTI agent and therefore
can cause unexpected memory leaks at the native side. The <a href="https://github.com/google/sanitizers/wiki/AddressSanitizer">AddressSanitizer (ASAN)</a>
is a great tool to catch such issues. It is touted as the ‘go-to’ tool for the native memory issues debugging. I compiled and linked the agent with
ASAN enabled and ran the reproducer.
Boom! It turns out that ASAN is very sensitive to SIGSEG (among other signals) and aborts analysis as soon as it discovers one.
The profiler library is a JVM agent and is running inside the JVM process. And the JVM is using SIGSEG for internal signalling.
To make things more interesting, the profiler library is relying on being able to handle SIGSEG when attempting to read
potentially invalid memory - we are effectively peeking in the JVM internals, and we need to be very defensive there as it
was not designed with this level of observability in mind.</p>

<p>There is a config option telling ASAN to ignore SIGSEGs, but it did not work for the LeakSanitizer (LSAN) subsystem.</p>

<p>Bottom line, ASAN is not an option for this case.</p>

<h3 id="valgrind">Valgrind</h3>

<p>After the fiasco with ASAN, I turned to <a href="https://valgrind.org/">Valgrind</a>. Valgrind is a bit more intrusive than ASAN, but it
is also more flexible. And you don’t need to modify the build process to use it. One can just take the already existing debug
build and run it under Valgrind using the <code class="language-plaintext highlighter-rouge">memcheck</code> tool.</p>

<p>Ok, let’s try this out. Fingers crossed!</p>

<p>Hm, it’s slow. I mean, really, really slow … but it seems to be working. After a long while I had my first Valgrind report.
Unfortunately, it was totally swamped by warnings caused by the GC managing memory in ways Valgrind does not like.
It is possible to configure the checks with the help of suppressions, but it is a tedious process. After a few more rounds
of running the reproducer, waiting for the report, and tweaking the suppressions, I gave up. The amount of noise was just too
high to be able to see the signal. Even with most of the nonsensical warnings suppressed, it gives literally thousands of
leak suspects which are most probably not leaks at all, coming from GC or runtime itself.</p>

<div class="language-shell highlighter-rouge"><div class="highlight"><pre class="highlight"><code><span class="o">==</span><span class="nv">315313</span><span class="o">==</span> LEAK SUMMARY:
<span class="o">==</span><span class="nv">315313</span><span class="o">==</span>    definitely lost: 20,029 bytes <span class="k">in </span>354 blocks
<span class="o">==</span><span class="nv">315313</span><span class="o">==</span>    indirectly lost: 114,141 bytes <span class="k">in </span>2,215 blocks
<span class="o">==</span><span class="nv">315313</span><span class="o">==</span>      possibly lost: 60,961,787 bytes <span class="k">in </span>244,974 blocks
<span class="o">==</span><span class="nv">315313</span><span class="o">==</span>    still reachable: 29,620,688 bytes <span class="k">in </span>3,188 blocks
<span class="o">==</span><span class="nv">315313</span><span class="o">==</span>        suppressed: 0 bytes <span class="k">in </span>0 blocks
</code></pre></div></div>

<p>I took L for Valgring as well. But wait, there is this tool in the Valgrind package, ‘massif’ which can be used to
profile the heap usage. But no, false alarm. Running the rerpoducer with ‘massif’ will just take down the JVM with
SIGSEG within a minute.</p>

<h3 id="ddprof">DDPROF</h3>

<p>When the standard solutions failed, it is time to try some dog-food. The <a href="https://github.com/DataDog/ddprof">DDPROF</a>
(Datadog Profiler for native code) contains a new beta feature called ‘live heap profiler’. The live heap profiler samples
OS level memory allocations (eg. via <code class="language-plaintext highlighter-rouge">malloc</code> or <code class="language-plaintext highlighter-rouge">new</code>) and tracks when the allocated chunks are released.
Subjectively, it is much faster than Valgrind (can’t compary to ASAN as it did not work for me) and should be able to
capture sufficiently prominent memory leaks.</p>

<p>The live heap profiling feature is currently available only in version <a href="https://github.com/DataDog/ddprof/releases/download/v0.17.0/ddprof-0.17.0-amd64-linux.tar.xz">0.17.0 of DDPROF</a>
and once that version is downloaded and extracted it can be used like this:</p>
<div class="language-shell highlighter-rouge"><div class="highlight"><pre class="highlight"><code>ddprof <span class="nt">-S</span> akka-uct-jdk11-notrace-native <span class="nt">-e</span> sALLOC,mode<span class="o">=</span>l <span class="nt">--inlined_functions</span> <span class="nb">true</span> <span class="nt">-worker_period</span> 300000 <span class="se">\</span>
  java <span class="nt">-Ddd</span>.env<span class="o">=</span><span class="k">${</span><span class="nv">WORKSPACE</span><span class="k">}</span> <span class="nt">-Ddd</span>.service<span class="o">=</span>akka-uct-jdk11-notrace <span class="se">\</span>
  <span class="nt">-Ddd</span>.profiling.enabled<span class="o">=</span><span class="nb">true</span> <span class="nt">-Ddd</span>.profiling.ddprof.enabled<span class="o">=</span><span class="nb">true</span> <span class="se">\</span>
  <span class="nt">-Ddd</span>.profiling.ddprof.liveheap.enabled<span class="o">=</span><span class="nb">true</span> <span class="nt">-Ddd</span>.profiling.ddprof.alloc.enabled<span class="o">=</span><span class="nb">true</span> <span class="nt">-Ddd</span>.profiling.upload.period<span class="o">=</span>10 <span class="se">\</span>
  <span class="nt">-Ddd</span>.profiling.timeline.events.enabled<span class="o">=</span><span class="nb">true</span> <span class="nt">-Ddd</span>.integration.renaissance.enabled<span class="o">=</span><span class="nb">true</span> <span class="nt">-Ddd</span>.env<span class="o">=</span>memleak-test <span class="se">\</span>
  <span class="nt">-Ddd</span>.trace.enabled<span class="o">=</span><span class="nb">false</span> <span class="se">\</span>
  <span class="nt">-Xmx512m</span> <span class="nt">-jar</span> renaissance-mit-0.15.0.jar akka-uct <span class="nt">-r</span> 1000000
</code></pre></div></div>

<p>The important part is <code class="language-plaintext highlighter-rouge">ddprof -S akka-uct-jdk11-notrace-native -e sALLOC,mode=l --inlined_functions true -worker_period 300000</code>
which configures the DDPROF to track allocation with liveness information (<code class="language-plaintext highlighter-rouge">-e sALLOC,mode=l</code>), resolve inlined function (<code class="language-plaintext highlighter-rouge">--inline_functions true</code>)
and to effectively not evacuate the liveness tracking table(<code class="language-plaintext highlighter-rouge">-worker_period 300000</code>). If the <code class="language-plaintext highlighter-rouge">-worker_period</code> is not specified
the liveness tracking table will be regularly evacuated in order to prevent secondary memory leaks in the DDPROF itself
(if an allocation is not released in the profiled application, the tracking entry in DDPROF would live forever without the
evacuation).
The rest of the command is just a standard configuration of both the native and Java specific profiler.</p>

<p>Having finished the setup in no time, I run the reproducer and keep it running for at least a few hours.
The results are interesting. As I already mentioned, this is a great example of dog-fooding. Using the Datadog DDPROF
tool to capture profiles that can then be analyzed in the Datadog platform.
Once all the data is in, I can use the comparison feature of the Datadog Continuous Profiler to compare the sample of live
allocations at the beginning of the run with the sample at the end of the run. Here is the result:</p>

<p><em>Fig1: Live heap profile comparison</em>
<img src="/assets/images/2024-04-17-stop-that-leak/comparison.png" alt="live_heap_comparison" /></p>

<p>The comparison is very intuitive, at least in my opinion. The red bars represent the increase of the retained allocations
from that particular allocation site. The green bars represent the decrease of the retained allocations. The blue bars are
showing the allocations that were not present in the first sample but are present in the second sample.</p>

<p>Using this information, it becomes obvious that something is off in the part of the code responsible for updating the
thread information. There are internal maps for converting the native thread ID to the Java thread ID and its name.
Since threads come and go, these maps are regularly cleaned up to avoid memory leaks. And here lies the problem.</p>

<div class="language-c++ highlighter-rouge"><div class="highlight"><pre class="highlight"><code><span class="c1">// Reset thread names and IDs</span>
<span class="n">MutexLocker</span> <span class="nf">ml</span><span class="p">(</span><span class="n">_thread_names_lock</span><span class="p">);</span>
<span class="k">if</span> <span class="p">(</span><span class="n">thread_ids</span><span class="p">.</span><span class="n">empty</span><span class="p">())</span> <span class="p">{</span>
    <span class="c1">// take the fast path</span>
    <span class="n">_thread_names</span><span class="p">.</span><span class="n">clear</span><span class="p">();</span>
    <span class="n">_thread_ids</span><span class="p">.</span><span class="n">clear</span><span class="p">();</span>
<span class="p">}</span> <span class="k">else</span> <span class="p">{</span>
    <span class="c1">// we need to honor the thread referenced from the liveness tracker</span>
    <span class="n">std</span><span class="o">::</span><span class="n">map</span><span class="o">&lt;</span><span class="kt">int</span><span class="p">,</span> <span class="n">std</span><span class="o">::</span><span class="n">string</span><span class="o">&gt;::</span><span class="n">iterator</span> <span class="n">name_itr</span> <span class="o">=</span> <span class="n">_thread_names</span><span class="p">.</span><span class="n">begin</span><span class="p">();</span>
    <span class="k">while</span> <span class="p">(</span><span class="n">name_itr</span> <span class="o">!=</span> <span class="n">_thread_names</span><span class="p">.</span><span class="n">end</span><span class="p">())</span> <span class="p">{</span>
        <span class="k">if</span> <span class="p">(</span><span class="n">thread_ids</span><span class="p">.</span><span class="n">find</span><span class="p">(</span><span class="n">name_itr</span><span class="o">-&gt;</span><span class="n">first</span><span class="p">)</span> <span class="o">!=</span> <span class="n">thread_ids</span><span class="p">.</span><span class="n">end</span><span class="p">())</span> <span class="p">{</span>
            <span class="n">name_itr</span> <span class="o">=</span> <span class="n">_thread_names</span><span class="p">.</span><span class="n">erase</span><span class="p">(</span><span class="n">name_itr</span><span class="p">);</span>
        <span class="p">}</span> <span class="k">else</span> <span class="p">{</span>
            <span class="o">++</span><span class="n">name_itr</span><span class="p">;</span>
        <span class="p">}</span>
    <span class="p">}</span>
    <span class="n">std</span><span class="o">::</span><span class="n">map</span><span class="o">&lt;</span><span class="kt">int</span><span class="p">,</span> <span class="n">jlong</span><span class="o">&gt;::</span><span class="n">iterator</span> <span class="n">id_itr</span> <span class="o">=</span> <span class="n">_thread_ids</span><span class="p">.</span><span class="n">begin</span><span class="p">();</span>
    <span class="k">while</span> <span class="p">(</span><span class="n">id_itr</span> <span class="o">!=</span> <span class="n">_thread_ids</span><span class="p">.</span><span class="n">end</span><span class="p">())</span> <span class="p">{</span>
        <span class="k">if</span> <span class="p">(</span><span class="n">thread_ids</span><span class="p">.</span><span class="n">find</span><span class="p">(</span><span class="n">name_itr</span><span class="o">-&gt;</span><span class="n">first</span><span class="p">)</span> <span class="o">!=</span> <span class="n">thread_ids</span><span class="p">.</span><span class="n">end</span><span class="p">())</span> <span class="p">{</span>
            <span class="n">id_itr</span> <span class="o">=</span> <span class="n">_thread_ids</span><span class="p">.</span><span class="n">erase</span><span class="p">(</span><span class="n">id_itr</span><span class="p">);</span>
        <span class="p">}</span> <span class="k">else</span> <span class="p">{</span>
            <span class="o">++</span><span class="n">id_itr</span><span class="p">;</span>
        <span class="p">}</span>
    <span class="p">}</span>
<span class="p">}</span>
</code></pre></div></div>

<p>Can you spot it? Yes, it’s the second loop, iterating over <code class="language-plaintext highlighter-rouge">id_itr</code> but checking the <code class="language-plaintext highlighter-rouge">thread_ids</code> for the <code class="language-plaintext highlighter-rouge">name_itr-&gt;first</code>.
To add insult to injury, the condition is wrong in both loops. The intention was to check if the <code class="language-plaintext highlighter-rouge">thread_ids</code> set, which is
the set of the thread ids being referenced from the liveness tracker, contains a particular thread id and if not, remove it.</p>

<p>However, the condition does the exact opposite!! No wonder the memory was leaking. The thread names and ids were almost never
cleaned up, even though they were not needed anymore.</p>

<h2 id="and-they-lived-happily-ever-after">And they lived happily ever after</h2>

<p>One would think so, but no. Once the library caused memory leak had been fixed I re-ran the reproducer. Surprisingly, the
RSS was still growing, although at much slower pace. The memory leak was fixed, but there was still something else causing
the memory to grow. The DDPROF live heap profiler was pointing to some internal JFR (JDK Flight Recorder) structures, but
that sounding like a red herring I decided to run the reproducer with a specific configuration where only JFR was enabled,
to rule out any interference from the profiler library. And the memory was still growing.</p>

<p><em>Fig2: RSS size with JFR only</em>
<img src="/assets/images/2024-04-17-stop-that-leak/rss.png" alt="rss_jfr_only" /></p>

<p>The DDPROF live heap profiler is pointing to the <code class="language-plaintext highlighter-rouge">JfrStackTraceRepository</code> class which seems to be growing continuously.</p>

<p><em>Fig3: Comparison of live heap profiles of JFR only reproducer</em>
<img src="/assets/images/2024-04-17-stop-that-leak/stacktrace_repository.png" alt="jfr_comparison" /></p>

<p>But, by all means, this should not be the case - re-checking the code that is responsible for the repository management,
the repository is cleared regularly. I also peppered the code with additional, very verbose logging to see if things are
as they seem and I could see that the repository was evicted regularly, all reference counts were going to zero after the
eviction and there were really no dangling pieces of memory out there.</p>

<p>After a lot of head scratching and soul-searching, I mentioned the issue to a colleague who pointed out that they had
similarly inexplicable memory leak in Ruby. And, surprisingly, the culprit was the internal fragmentation of the glibc
malloc implementation.</p>

<p>The issue is well described by my colleague Brice Dutheil in <a href="https://blog.arkey.fr/drafts/2021/01/22/native-memory-fragmentation-with-glibc/">his blog post</a></p>

<p>The remedy is to use an alternative allocator, like <a href="https://jemalloc.net/">jemalloc</a> or <a href="https://github.com/google/tcmalloc">tcmalloc</a>.</p>

<p>Once I siwtched to tcmalloc, the memory growth stopped and the RSS stabilized.</p>

<p><em>Fig4: RSS size with JFR and tcmalloc</em>
<img src="/assets/images/2024-04-17-stop-that-leak/tcmalloc.png" alt="rss_tcmalloc" /></p>

<h2 id="conclusion">Conclusion</h2>

<p>The memory leak was fixed in no time and the fix will be deployed to our customers’ environments in the near future.
It is a bit embarrassing that such a simple bug could have escaped our attention. Obviously, if the standard tools, like ASAN,
were working for JVM we could have caught it immediately before ever being shipped. But if ifs and buts …</p>

<p>On the other hand, I was pleasantly surprised by the DDPROF live heap profiler. The setup was easy, the overhead almost
undetectable, and the results were very intuitive - despite me being quite sceptical</p>

<p>The next steps will involve adding a specific configuration to our reliability tests to run the akka-uct benchmark <em>with</em>
the DDPROF live heap profiler and use the results to assess the situation of possible memory leaks regularly.</p>

<p>The JFR memory leak was a bit more tricky. The DDPROF live heap profiler was pointing to the wrong direction, but with a bit
of luck, the real culprit was discovered. Probably, the allocation patterns in JFR could be optimized to avoid the internal
fragmentation, but until then one would need to use an alternative allocator to avoid the issue.</p>

<p>It is very interesting that the malloc fragmentation is affecting the DDPROF live heap profile. There is no other reason
for the profile to be what it is but the fragmentation. Yet, the reference counting should still work there.
There are certainly some interesting things to investigate and improve the live heap profiler.</p>]]></content><author><name></name></author><category term="java" /><category term="jvm" /><category term="openjdk" /><category term="native" /><summary type="html"><![CDATA[]]></summary></entry><entry><title type="html">Seeing In Context: A journey to contextualized JFR profiles (part 3)</title><link href="/posts/seeing-in-context_3" rel="alternate" type="text/html" title="Seeing In Context: A journey to contextualized JFR profiles (part 3)" /><published>2023-10-12T13:00:00+00:00</published><updated>2023-10-12T13:00:00+00:00</updated><id>/posts/seeing-in-context_3</id><content type="html" xml:base="/posts/seeing-in-context_3"><![CDATA[<ol id="markdown-toc">
  <li><a href="#integrating-with-existing-tracers" id="markdown-toc-integrating-with-existing-tracers">Integrating with existing tracers</a>    <ol>
      <li><a href="#searching-for-integration-points" id="markdown-toc-searching-for-integration-points">Searching for integration points</a></li>
      <li><a href="#exposing-contextaccess" id="markdown-toc-exposing-contextaccess">Exposing ContextAccess</a>        <ol>
          <li><a href="#a-note-about-picking-the-annotation-type" id="markdown-toc-a-note-about-picking-the-annotation-type">A note about picking the annotation type</a></li>
        </ol>
      </li>
      <li><a href="#supporting-primitive-types-for-context-values" id="markdown-toc-supporting-primitive-types-for-context-values">Supporting primitive types for context values</a>        <ol>
          <li><a href="#ddspancontext-example" id="markdown-toc-ddspancontext-example">DDSpanContext example</a>            <ol>
              <li><a href="#modify-ddspancontext-class" id="markdown-toc-modify-ddspancontext-class">Modify DDSpanContext class</a></li>
              <li><a href="#obtain-and-use-contextaccess-instance" id="markdown-toc-obtain-and-use-contextaccess-instance">Obtain and use ContextAccess instance</a></li>
            </ol>
          </li>
        </ol>
      </li>
    </ol>
  </li>
  <li><a href="#wrap-up" id="markdown-toc-wrap-up">Wrap up</a></li>
</ol>

<h1 id="integrating-with-existing-tracers">Integrating with existing tracers</h1>

<p>I’ve already shown the <a href="/posts/seeing-in-context_1">basic concepts of profiling context</a> and talked 
about <a href="/posts/seeing-in-context_2">how the proposed JFR API would look like</a>.</p>

<p>Although having a shiny new API to deal with the profiling context is nice, we cannot forget about the existing code 
already dealing with the context - the distributed tracers. Whether we talk about<a href="https://opentelemetry.io/">OpenTelemetry</a>,
<a href="https://opentracing.io/">OpenTracing</a>, <a href="https://opencensus.io/">OpenCensus</a>, or any of the proprietary implementations, 
the proposed JFR API must allow for an easy, cheap, and non-intrusive integration.</p>

<h2 id="searching-for-integration-points">Searching for integration points</h2>

<p>A brief look at  <a href="https://opentelemetry.io/">OpenTelemetry</a> and  <a href="https://github.com/DataDog/dd-trace-java">DD Tracer</a> confirmed 
that they are already dealing with the context problem in a broader way than what the proposed JFR API is supposed to tackle. 
Namely, the distributed tracers are taking care of maintaining the context stack and propagating the context around via extensive 
instrumentation. And the propagation is not restricted to the same JVM but, as the ‘distributed’ part suggests, they are
able to transfer the context to other processes, hosts, and networks just as easily.</p>

<p>The JFR API proposal was never meant to deal with the distributed context in all of its nuances - rather it is supposed 
to be a public and supported way any tracer implementation could use to make the JFR recordings aware of the context 
they are working with.</p>

<p>The fact that the tracers are already maintaining their own context rules out using the custom ContextType directly as 
that would require either a parallel machinery to maintain the context stack and perform the context propagation or 
setting up mirroring parts of the tracer context to the custom ContextType, potentially resulting in much increased 
allocation rates and memory copies. As we all can see, this approach would not meet any of the ‘easy’, ‘cheap’, 
or ‘non-intrusive’ requirements.</p>

<h2 id="exposing-contextaccess">Exposing ContextAccess</h2>

<p>Instead of relying on the stateful context representation via a custom <code class="language-plaintext highlighter-rouge">ContextType</code>, I propose providing a <code class="language-plaintext highlighter-rouge">ContextAccess</code>
which can be generated for any type (POJO) with the only requirement of the class being annotated by <code class="language-plaintext highlighter-rouge">@Name</code> and at least
one field or method returning a value being annotated by <code class="language-plaintext highlighter-rouge">@Name</code> as well.</p>

<p>Once such <code class="language-plaintext highlighter-rouge">ContextAccess</code> instance is obtained, it can be used to <code class="language-plaintext highlighter-rouge">set</code> or <code class="language-plaintext highlighter-rouge">unset</code> the context from a specific instance of
the given type. The access implementation will use the information about which fields/methods are annotated by <code class="language-plaintext highlighter-rouge">@Name</code> to
properly fill the context slots by the values extracted from those fields and methods.</p>

<h4 id="a-note-about-picking-the-annotation-type">A note about picking the annotation type</h4>
<p>The <code class="language-plaintext highlighter-rouge">@Name</code> annotation was picked as something non-intrusive and is guaranteed to exist in all supported versions of OpenJDK,
as long as it was compiled with JFR enabled.</p>

<p>An alternative would be to use specific annotations for context type declaration, but that would require an ASM-based annotation 
detection as opposed to the currently used reflection-based one. This is because the annotations coming from a newer JDK 
would not be resolvable in older JDKs.</p>

<h2 id="supporting-primitive-types-for-context-values">Supporting primitive types for context values</h2>

<p>In order to facilitate zero-conversion integrations, it is necessary to increase the set of supported context attribute types.
If we stick to supporting only <code class="language-plaintext highlighter-rouge">string</code>, the amount of conversions between, e.g., long values and strings would definitely
become rather costly, as it would have to be done every single time the context is manipulated.</p>

<p>Instead, the definition of a context type is relaxed to allow attributes of any primitive type as well as string/charsequence.
This comes at no extra cost since JFR already supports all the primitive types anyway.</p>

<h3 id="ddspancontext-example">DDSpanContext example</h3>

<h4 id="modify-ddspancontext-class">Modify DDSpanContext class</h4>

<figure class="highlight"><pre><code class="language-java" data-lang="java"><span class="c1">// expose only `rootspanid', `spanid` and `operation_name` attributes.</span>
<span class="nd">@Name</span><span class="o">(</span><span class="s">"dd-context"</span><span class="o">)</span> <span class="c1">// add this annotation such that type can be accepted for context </span>
<span class="kd">public</span> <span class="kd">class</span> <span class="nc">DDSpanContext</span>
  <span class="kd">implements</span> <span class="nc">AgentSpan</span><span class="o">.</span><span class="na">Context</span><span class="o">,</span> <span class="nc">RequestContext</span><span class="o">,</span> <span class="nc">TraceSegment</span><span class="o">,</span> <span class="nc">ProfilerContext</span> <span class="o">{</span>
  <span class="c1">// bunch of fields defining the context - all of them private</span>

  <span class="nd">@Name</span><span class="o">(</span><span class="s">"rootspanid"</span><span class="o">)</span> <span class="c1">// context attribute getter method</span>
  <span class="kd">public</span> <span class="kt">long</span> <span class="nf">getRootSpanID</span><span class="o">()</span> <span class="o">{</span>
    <span class="k">return</span> <span class="n">rootSpanID</span><span class="o">;</span>
  <span class="o">}</span>

  <span class="nd">@Name</span><span class="o">(</span><span class="s">"spanid"</span><span class="o">)</span>
  <span class="kd">public</span> <span class="kt">long</span> <span class="nf">getSpanID</span><span class="o">()</span> <span class="o">{</span>
    <span class="k">return</span> <span class="n">spanID</span><span class="o">;</span>
  <span class="o">}</span>

  <span class="nd">@Name</span><span class="o">(</span><span class="s">"operation_name"</span><span class="o">)</span>
  <span class="kd">public</span> <span class="nc">CharSequence</span> <span class="nf">getOperationName</span><span class="o">()</span> <span class="o">{</span>
     <span class="k">return</span> <span class="n">operationName</span><span class="o">;</span>
  <span class="o">}</span>

  <span class="c1">// more context stuff</span>
<span class="o">}</span></code></pre></figure>

<h4 id="obtain-and-use-contextaccess-instance">Obtain and use ContextAccess instance</h4>

<figure class="highlight"><pre><code class="language-java" data-lang="java"><span class="nc">DDSPanContext</span> <span class="n">context</span> <span class="o">=</span> <span class="k">new</span> <span class="nc">DDSpanContext</span><span class="o">(...);</span>
<span class="nc">ContextAccess</span><span class="o">&lt;</span><span class="nc">DDPspanContext</span><span class="o">&gt;</span> <span class="n">access</span> <span class="o">=</span> <span class="nc">ContextAccess</span><span class="o">.</span><span class="na">forType</span><span class="o">(</span><span class="nc">DDSpanContext</span><span class="o">.</span><span class="na">class</span><span class="o">);</span>
<span class="o">...</span>
<span class="c1">// context is all set up, just activate it</span>
<span class="n">access</span><span class="o">.</span><span class="na">set</span><span class="o">(</span><span class="n">context</span><span class="o">);</span>
<span class="o">...</span>
<span class="n">access</span><span class="o">.</span><span class="na">unset</span><span class="o">();</span> <span class="c1">// deactivation is not instance specific</span></code></pre></figure>

<p>If you want to see the actual working integration, you can find this <a href="https://github.com/DataDog/dd-trace-java/pull/6013">draft PR</a>
quite interesting. The PR description contains the guide for building the patched DD tracer agent to run against the patched 
<a href="https://github.com/DataDog/openjdk-jdk21/tree/jb/jfr_context_bp">OpenJDK 21</a>.</p>

<p>The original JFR context prototype had to be backported from OpenJDK 22 because the DD tracer cannot be built and used on 
OpenJDK 22 due to the lack of support in <a href="https://asm.ow2.io/">ASM</a>. This is because <a href="https://asm.ow2.io/">ASM</a> can support 
only released JDK versions.</p>

<p><em>The captured JFR would look something like this in JMC</em></p>

<p><img src="/assets/images/2023-10-13-seeing_in_context_3/JFR_context_JMC.png" alt="JFR recording with context" /></p>

<h1 id="wrap-up">Wrap up</h1>

<p>In this blog series, I have attempted to build a case for introducing the notion of context to JFR events. To support 
my case, I also proposed the API form and provided a prototype implementation for OpenJDK, as well as a PoC for 
integration with the Datadog tracer agent.</p>

<p>My impression is that the current API form suits the purpose of building context-aware applications and libraries, 
and it also integrates well with existing context-tracking solutions.</p>

<p>The implementation itself is prototypical, covering mostly only the happy paths. However, it should be sufficient to 
gather initial feedback about the feasibility of this approach and to serve as the foundation for the JEP preparation phase.</p>

<p>As always, if you wish to try out the API or consider adding an integration for your favorite tracer, please reach out 
to me on X via <a href="https://twitter.com/BachorikJ">@BachorikJ</a>.</p>]]></content><author><name></name></author><category term="java" /><category term="jvm" /><category term="jfr" /><category term="openjdk" /><category term="profiling" /><category term="performance" /><summary type="html"><![CDATA[]]></summary></entry><entry><title type="html">Mysterious jmethodID</title><link href="/posts/mysterious-jmethodid" rel="alternate" type="text/html" title="Mysterious jmethodID" /><published>2023-10-12T13:00:00+00:00</published><updated>2023-10-12T13:00:00+00:00</updated><id>/posts/mysterious-jmethodid</id><content type="html" xml:base="/posts/mysterious-jmethodid"><![CDATA[<ol id="markdown-toc">
  <li><a href="#what-is-jmethodid-and-why-do-i-care" id="markdown-toc-what-is-jmethodid-and-why-do-i-care">What is jmethodID and why do I care</a>    <ol>
      <li><a href="#jmethodid-and-profilers" id="markdown-toc-jmethodid-and-profilers">jmethodID and profilers</a></li>
    </ol>
  </li>
  <li><a href="#investigation" id="markdown-toc-investigation">Investigation</a>    <ol>
      <li><a href="#what-is-that-assert-doing" id="markdown-toc-what-is-that-assert-doing">What is that assert doing</a></li>
      <li><a href="#hygiene-is-important" id="markdown-toc-hygiene-is-important">Hygiene is important</a></li>
      <li><a href="#asserts-and-guarantees" id="markdown-toc-asserts-and-guarantees">Asserts and guarantees</a></li>
      <li><a href="#down-the-rabbit-hole" id="markdown-toc-down-the-rabbit-hole">Down the rabbit hole</a></li>
      <li><a href="#lets-fix-it" id="markdown-toc-lets-fix-it">Let’s fix it!</a></li>
      <li><a href="#what-is-the-real-cause" id="markdown-toc-what-is-the-real-cause">What is the real cause?</a></li>
      <li><a href="#there-is-still-more-to-it" id="markdown-toc-there-is-still-more-to-it">There is still more to it</a>        <ol>
          <li><a href="#diagram-time" id="markdown-toc-diagram-time">Diagram time</a></li>
        </ol>
      </li>
    </ol>
  </li>
  <li><a href="#next-steps" id="markdown-toc-next-steps">Next steps</a></li>
</ol>

<h1 id="what-is-jmethodid-and-why-do-i-care">What is jmethodID and why do I care</h1>

<p>Let me start with a short introduction to the concept of <code class="language-plaintext highlighter-rouge">jmethodID</code>.</p>

<p>When working in the realm of JNI (Java Native Interface), we can obtain references to Java methods which can later be used to, for example, invoke the method. The reference to the method is represented by a <code class="language-plaintext highlighter-rouge">jmethodID</code> type, which is an opaque pointer to a structure containing the method’s metadata.</p>

<p>Why do we need an opaque pointer instead of just using the method reference in the form of jmethod directly? The answer is simple - the method reference is not stable. With the ability to retransform classes, the method reference can change at any time, invalidating any previously obtained references. Therefore, JNI uses the <code class="language-plaintext highlighter-rouge">jmethodID</code> type to represent the method reference, which is stable and can be used to invoke the method even after retransformations. The runtime will ensure the <code class="language-plaintext highlighter-rouge">jmethodID</code> is updated to point to the correct method metadata after retransformation.</p>

<p>However, there is one caveat: the <code class="language-plaintext highlighter-rouge">jmethodID</code> is only valid as long as there is a strong reference to the class containing the method that the <code class="language-plaintext highlighter-rouge">jmethodID</code> is pointing to. Once the class is unloaded, the <code class="language-plaintext highlighter-rouge">jmethodID</code> becomes invalid, and when it is used to resolve to a jmethod instance, it will return NULL. Although this is Hotspot-specific behavior, it is not something required by the JNI specification. As such, crashes may occur in other JVM (Java Virtual Machine) implementations when using invalid <code class="language-plaintext highlighter-rouge">jmethodID</code> values.</p>

<p>Later in this article, I will focus on the Hotspot implementation of <code class="language-plaintext highlighter-rouge">jmethodID</code> and how invalid <code class="language-plaintext highlighter-rouge">jmethodID</code> values can still pose problems.</p>

<h2 id="jmethodid-and-profilers">jmethodID and profilers</h2>

<p>Unsurprisingly, the stack traces obtained via the <code class="language-plaintext highlighter-rouge">GetStackTrace</code> or <code class="language-plaintext highlighter-rouge">GetAllStackTraces</code> JNI functions have their stack frames represented by <code class="language-plaintext highlighter-rouge">jmethodID</code> values. However, for all threads except the current one, it is impossible to guarantee that the classes referenced in the stack trace via <code class="language-plaintext highlighter-rouge">jmethodID</code> will be strongly held, making the behavior more or less undefined.</p>

<p>In Hotspot, the implementation is hardened and is supposed to handle invalid <code class="language-plaintext highlighter-rouge">jmethodID</code> values gracefully, compensating for this hole in the specification.</p>

<p>However, there is a bug - <a href="https://bugs.openjdk.org/browse/JDK-8313816">JDK-8313816</a> - causing spurious JVM crashes when trying to resolve the <code class="language-plaintext highlighter-rouge">jmethodID</code> values captured as a stack trace sometime later after obtaining the stack trace. The bug is not easy to reproduce, and it took a significant amount of time to find a reliable reproducer. The reproducer is not perfect, but it is good enough to trigger the crashes reliably. Unfortunately, it is a test suite of an internal project that heavily uses Mockito and will trigger the crashes within a few tens of seconds.</p>

<p>The sad reality is that this crash makes any profiler implementation using the JVMTI functions to obtain stack traces unusable in an always-on, in-production manner.</p>

<h1 id="investigation">Investigation</h1>

<p>I must admit, this particular crash has preoccupied me for many months. Not completely understanding the underlying
implementation, I took several wrong turns and even proposed a patch, which turned out to solve nothing. But all that time,
I was convinced there was a subtle bug in the Hotspot implementation of <code class="language-plaintext highlighter-rouge">jmethodid</code>, while many people remained
skeptical, attributing the crash to incorrect usage of <code class="language-plaintext highlighter-rouge">jmethodid</code> values.</p>

<h2 id="what-is-that-assert-doing">What is that assert doing</h2>

<p>The vast majority of the crashes were happening in <code class="language-plaintext highlighter-rouge">Method::checked_resolve_jmethod_id()</code> call. While examining the code
I skimmed over this statement</p>

<figure class="highlight"><pre><code class="language-cpp" data-lang="cpp"><span class="n">assert</span><span class="p">(</span><span class="n">is_valid_method</span><span class="p">(</span><span class="n">o</span><span class="p">),</span> <span class="s">"should be valid jmethodid"</span><span class="p">);</span></code></pre></figure>

<p>just assuming that under normal circumstances this assert should never trigger. Well, that is until I ran the reproducer
with fastdebug OpenJDK build which enabled all those asserts. And suddenly, I saw the root cause for all those various 
crashes - the captured <code class="language-plaintext highlighter-rouge">jmethodid</code> values are becoming invalid and when they are used there is a good chance of crashing JVM.</p>

<p>So, I set out on checking the source code of the <code class="language-plaintext highlighter-rouge">Method::is_valid_method()</code> function.</p>

<figure class="highlight"><pre><code class="language-cpp" data-lang="cpp"><span class="c1">// Check that this pointer is valid by checking that the vtbl pointer matches</span>
<span class="kt">bool</span> <span class="n">Method</span><span class="o">::</span><span class="n">is_valid_method</span><span class="p">(</span><span class="k">const</span> <span class="n">Method</span><span class="o">*</span> <span class="n">m</span><span class="p">)</span> <span class="p">{</span>
  <span class="k">if</span> <span class="p">(</span><span class="n">m</span> <span class="o">==</span> <span class="nb">nullptr</span><span class="p">)</span> <span class="p">{</span>
    <span class="k">return</span> <span class="nb">false</span><span class="p">;</span>
  <span class="p">}</span> <span class="k">else</span> <span class="k">if</span> <span class="p">((</span><span class="kt">intptr_t</span><span class="p">(</span><span class="n">m</span><span class="p">)</span> <span class="o">&amp;</span> <span class="p">(</span><span class="n">wordSize</span><span class="o">-</span><span class="mi">1</span><span class="p">))</span> <span class="o">!=</span> <span class="mi">0</span><span class="p">)</span> <span class="p">{</span>
    <span class="c1">// Quick sanity check on pointer.</span>
    <span class="k">return</span> <span class="nb">false</span><span class="p">;</span>
  <span class="p">}</span> <span class="k">else</span> <span class="k">if</span> <span class="p">(</span><span class="o">!</span><span class="n">os</span><span class="o">::</span><span class="n">is_readable_range</span><span class="p">(</span><span class="n">m</span><span class="p">,</span> <span class="n">m</span> <span class="o">+</span> <span class="mi">1</span><span class="p">))</span> <span class="p">{</span>
    <span class="k">return</span> <span class="nb">false</span><span class="p">;</span>
  <span class="p">}</span> <span class="k">else</span> <span class="k">if</span> <span class="p">(</span><span class="n">m</span><span class="o">-&gt;</span><span class="n">is_shared</span><span class="p">())</span> <span class="p">{</span>
    <span class="k">return</span> <span class="n">CppVtables</span><span class="o">::</span><span class="n">is_valid_shared_method</span><span class="p">(</span><span class="n">m</span><span class="p">);</span>
  <span class="p">}</span> <span class="k">else</span> <span class="k">if</span> <span class="p">(</span><span class="n">Metaspace</span><span class="o">::</span><span class="n">contains_non_shared</span><span class="p">(</span><span class="n">m</span><span class="p">))</span> <span class="p">{</span>
    <span class="k">return</span> <span class="n">has_method_vptr</span><span class="p">((</span><span class="k">const</span> <span class="kt">void</span><span class="o">*</span><span class="p">)</span><span class="n">m</span><span class="p">);</span>
  <span class="p">}</span> <span class="k">else</span> <span class="p">{</span>
    <span class="k">return</span> <span class="nb">false</span><span class="p">;</span>
  <span class="p">}</span>
<span class="p">}</span></code></pre></figure>

<p>Well, that’s a few cases where <code class="language-plaintext highlighter-rouge">jmethodid</code> can be invalid! But which ones are triggering when I am getting the follow-up crash? In order to do that, I resorted to ‘printf debugging’, inserting <code class="language-plaintext highlighter-rouge">printf</code> statements into each branch with a ‘unique’ id, so it would be easy to match the failed precondition with the code path leading to the crash.</p>

<p>Long story short - when <code class="language-plaintext highlighter-rouge">has_method_vptr((const void*)m)</code> returns <code class="language-plaintext highlighter-rouge">false</code> and such an invalid <code class="language-plaintext highlighter-rouge">jmethodid</code> is then used, it is almost certain that usage will crash the JVM. Well, we are trying to use a memory blob as an object instance, but it is missing the valid object header. It only makes sense that this attempt can lead to very bad things.</p>

<h2 id="hygiene-is-important">Hygiene is important</h2>

<p>At this point, I formed a hypothesis that the affected <code class="language-plaintext highlighter-rouge">jmethodID</code> is pointing to a <code class="language-plaintext highlighter-rouge">Method</code> object which was reclaimed, and part or all of the memory originally occupied by that instance was overwritten.</p>

<p>The 100-point question is: when can a <code class="language-plaintext highlighter-rouge">Method</code> object be reclaimed? Well, it turns out the JVM is very strict about that. A <code class="language-plaintext highlighter-rouge">Method</code> can be reclaimed only when its containing class is unloaded. And when is a class allowed to be unloaded? Only when its associated classloader is not referenced anymore. A bit of code searching and following call sites led me to <code class="language-plaintext highlighter-rouge">ClassLoaderData::unload()</code>. And indeed, the <code class="language-plaintext highlighter-rouge">jmethodIDs</code> associated with the methods from that class loader are wiped in order to make sure they will not be pointing to deallocated objects.</p>

<figure class="highlight"><pre><code class="language-cpp" data-lang="cpp">  <span class="c1">// Method::clear_jmethod_ids only sets the jmethod_ids to null without</span>
  <span class="c1">// releasing the memory for related JNIMethodBlocks and JNIMethodBlockNodes.</span>
  <span class="c1">// This is done intentionally because native code (e.g. JVMTI agent) holding</span>
  <span class="c1">// jmethod_ids may access them after the associated classes and class loader</span>
  <span class="c1">// are unloaded. The Java Native Interface Specification says "method ID</span>
  <span class="c1">// does not prevent the VM from unloading the class from which the ID has</span>
  <span class="c1">// been derived. After the class is unloaded, the method or field ID becomes</span>
  <span class="c1">// invalid". In real world usages, the native code may rely on jmethod_ids</span>
  <span class="c1">// being null after class unloading. Hence, it is unsafe to free the memory</span>
  <span class="c1">// from the VM side without knowing when native code is going to stop using</span>
  <span class="c1">// them.</span>
  <span class="k">if</span> <span class="p">(</span><span class="n">_jmethod_ids</span> <span class="o">!=</span> <span class="nb">nullptr</span><span class="p">)</span> <span class="p">{</span>
    <span class="n">Method</span><span class="o">::</span><span class="n">clear_jmethod_ids</span><span class="p">(</span><span class="k">this</span><span class="p">);</span>
  <span class="p">}</span></code></pre></figure>

<p>So, this should work, right? Hotspot takes care of nulling the references to ensure no invalid memory can be accessed via dangling pointers, and unloading is conducted in a VM operation, guaranteeing that the native code and the unloading process never race. All parts are in place, and yet, it is still possible to trigger a JVM crash quite reliably. There must be something else at play.</p>

<h2 id="asserts-and-guarantees">Asserts and guarantees</h2>

<p>You are probably familiar with the concept of code asserts - they should capture invariants and fail if these are broken. Since the invariants are supposed to hold at all times, usually the asserts are enabled only in ‘debug’ builds. This makes them extremely cheap in non-debug builds, because they are physically removed from the resulting machine code.</p>

<p>In the JVM codebase, in addition to <code class="language-plaintext highlighter-rouge">assert</code>, there is also <code class="language-plaintext highlighter-rouge">guarantee</code>. Guarantee works pretty much like an assert, with the difference that <code class="language-plaintext highlighter-rouge">guarantee</code> will trigger also in a non-debug build.</p>

<p>‘What are you getting at?’, you might ask now. The answer is simple - I needed a way to ‘annotate’ the JVM code dealing with <code class="language-plaintext highlighter-rouge">jmethodIDs</code>, and particularly, deallocating the <code class="language-plaintext highlighter-rouge">Method</code> instances with various invariant checks. But, since my reproducer is quite a large application, running it with a debug build became quite problematic because it became really, really slow. So, I used temporary guarantees instead.</p>

<p>In the <code class="language-plaintext highlighter-rouge">InstanceKlass</code> class, which represents Java class metadata (very simply put), there is an interestingly looking function <code class="language-plaintext highlighter-rouge">deallocate_contents()</code>.</p>

<figure class="highlight"><pre><code class="language-cpp" data-lang="cpp"><span class="c1">// This function deallocates the metadata and C heap pointers that the</span>
<span class="c1">// InstanceKlass points to.</span>
<span class="kt">void</span> <span class="n">InstanceKlass</span><span class="o">::</span><span class="n">deallocate_contents</span><span class="p">(</span><span class="n">ClassLoaderData</span><span class="o">*</span> <span class="n">loader_data</span><span class="p">)</span></code></pre></figure>

<p>This function, in turn, calls <code class="language-plaintext highlighter-rouge">InstanceKlass::deallocate_methods()</code>, which takes care of physically deallocating all
the <code class="language-plaintext highlighter-rouge">Method</code> instances contained in the current <code class="language-plaintext highlighter-rouge">InstanceKlass</code>. That looks promising - the assumption is that once
a <code class="language-plaintext highlighter-rouge">Method</code> instance is deallocated, the <code class="language-plaintext highlighter-rouge">jmethodid</code> pointing to that method should be updated to <code class="language-plaintext highlighter-rouge">nullptr</code> instead.
This should be quite easy to express as an invariant via <code class="language-plaintext highlighter-rouge">guarantee</code> -</p>

<figure class="highlight"><pre><code class="language-cpp" data-lang="cpp"><span class="kt">void</span> <span class="n">InstanceKlass</span><span class="o">::</span><span class="n">deallocate_methods</span><span class="p">(</span><span class="n">ClassLoaderData</span><span class="o">*</span> <span class="n">loader_data</span><span class="p">,</span>
                                       <span class="n">Array</span><span class="o">&lt;</span><span class="n">Method</span><span class="o">*&gt;*</span> <span class="n">methods</span><span class="p">)</span> <span class="p">{</span>
  <span class="k">if</span> <span class="p">(</span><span class="n">methods</span> <span class="o">!=</span> <span class="nb">nullptr</span> <span class="o">&amp;&amp;</span> <span class="n">methods</span> <span class="o">!=</span> <span class="n">Universe</span><span class="o">::</span><span class="n">the_empty_method_array</span><span class="p">()</span> <span class="o">&amp;&amp;</span>
      <span class="o">!</span><span class="n">methods</span><span class="o">-&gt;</span><span class="n">is_shared</span><span class="p">())</span> <span class="p">{</span>
    <span class="k">for</span> <span class="p">(</span><span class="kt">int</span> <span class="n">i</span> <span class="o">=</span> <span class="mi">0</span><span class="p">;</span> <span class="n">i</span> <span class="o">&lt;</span> <span class="n">methods</span><span class="o">-&gt;</span><span class="n">length</span><span class="p">();</span> <span class="n">i</span><span class="o">++</span><span class="p">)</span> <span class="p">{</span>
      <span class="n">Method</span><span class="o">*</span> <span class="n">method</span> <span class="o">=</span> <span class="n">methods</span><span class="o">-&gt;</span><span class="n">at</span><span class="p">(</span><span class="n">i</span><span class="p">);</span>
      <span class="k">if</span> <span class="p">(</span><span class="n">method</span> <span class="o">==</span> <span class="nb">nullptr</span><span class="p">)</span> <span class="k">continue</span><span class="p">;</span>  <span class="c1">// maybe null if error processing</span>
      <span class="c1">// Only want to delete methods that are not executing for RedefineClasses.</span>
      <span class="c1">// The previous version will point to them so they're not totally dangling</span>
      <span class="n">assert</span> <span class="p">(</span><span class="o">!</span><span class="n">method</span><span class="o">-&gt;</span><span class="n">on_stack</span><span class="p">(),</span> <span class="s">"shouldn't be called with methods on stack"</span><span class="p">);</span>
      
      <span class="c1">// &gt;&gt;&gt; inserted code</span>
      <span class="c1">// try and resolve the jmethodid from the `Method` instance</span>
      <span class="n">jmethodID</span> <span class="n">jmid</span> <span class="o">=</span> <span class="n">method</span><span class="o">-&gt;</span><span class="n">find_jmethod_id_or_null</span><span class="p">();</span>
      <span class="c1">// &lt;&lt;&lt;</span>
      
      <span class="n">MetadataFactory</span><span class="o">::</span><span class="n">free_metadata</span><span class="p">(</span><span class="n">loader_data</span><span class="p">,</span> <span class="n">method</span><span class="p">);</span>
      
      <span class="c1">// &gt;&gt;&gt; inserted code</span>
      <span class="c1">// The method that was deallocated must not have a jmethodid pointing to it</span>
      <span class="c1">// Because class redefinitions/retransformations can introduce new method versions</span>
      <span class="c1">// a jmethodid pointing to the original version will be updated to point to newer version</span>
      <span class="c1">// making it necessary to also assert that the jmethodid is actually pointing to the method</span>
      <span class="c1">// being deallocated  </span>
      <span class="n">guarantee</span><span class="p">(</span><span class="n">jmid</span> <span class="o">==</span> <span class="nb">nullptr</span> <span class="o">||</span> <span class="o">*</span><span class="p">((</span><span class="n">Method</span><span class="o">**</span><span class="p">)</span><span class="n">jmid</span><span class="p">)</span> <span class="o">==</span> <span class="nb">nullptr</span> <span class="o">||</span> <span class="o">*</span><span class="p">((</span><span class="n">Method</span><span class="o">**</span><span class="p">)</span><span class="n">jmid</span><span class="p">)</span> <span class="o">!=</span> <span class="n">method</span><span class="p">,</span> <span class="s">"jmethodid was not cleaned up: %p"</span><span class="p">,</span> <span class="p">(</span><span class="kt">void</span><span class="o">*</span><span class="p">)</span><span class="n">jmid</span><span class="p">);</span>
      <span class="c1">// &lt;&lt;&lt;</span>
    <span class="p">}</span>
    <span class="n">MetadataFactory</span><span class="o">::</span><span class="n">free_array</span><span class="o">&lt;</span><span class="n">Method</span><span class="o">*&gt;</span><span class="p">(</span><span class="n">loader_data</span><span class="p">,</span> <span class="n">methods</span><span class="p">);</span>
  <span class="p">}</span>
<span class="p">}</span></code></pre></figure>

<p>Rebuilding the OpenJDK with the added guarantee and rerunning the reproducer quickly demonstrates that there is indeed an invariant violation. As expected, the guarantee fails, resulting in the following stack trace:</p>

<figure class="highlight"><pre><code class="language-stack" data-lang="stack">Stack: [0x000000016f708000,0x000000016f90b000],  sp=0x000000016f90a7b0,  free space=2057k
Native frames: (J=compiled Java code, j=interpreted, Vv=VM code, C=native code)
V  [libjvm.dylib+0xa5def0]  VMError::report_and_die(int, char const*, char const*, char*, Thread*, unsigned char*, void*, void*, char const*, int, unsigned long)+0x52c  (instanceKlass.cpp:551)
V  [libjvm.dylib+0xa5e64c]  VMError::report_and_die(Thread*, char const*, int, unsigned long, VMErrorType, char const*, char*)+0x0
V  [libjvm.dylib+0x2d9bb4]  print_error_for_unit_test(char const*, char const*, char*)+0x0
V  [libjvm.dylib+0x47da14]  InstanceKlass::deallocate_methods(ClassLoaderData*, Array&lt;Method*&gt;*)+0x14c
V  [libjvm.dylib+0x47dcfc]  InstanceKlass::deallocate_contents(ClassLoaderData*)+0x94
V  [libjvm.dylib+0x487b70]  InstanceKlass::purge_previous_version_list()+0xc4
V  [libjvm.dylib+0x25b08c]  ClassLoaderData::classes_do(void (*)(InstanceKlass*))+0x3c
V  [libjvm.dylib+0x25ed24]  ClassLoaderDataGraph::clean_deallocate_lists(bool)+0x7c
V  [libjvm.dylib+0x25ee08]  ClassLoaderDataGraph::walk_metadata_and_clean_metaspaces()+0x38
V  [libjvm.dylib+0xa64ad4]  VM_Operation::evaluate()+0xe4
V  [libjvm.dylib+0xa71458]  VMThread::evaluate_operation(VM_Operation*)+0xe4
V  [libjvm.dylib+0xa71c90]  VMThread::inner_execute(VM_Operation*)+0x28c
V  [libjvm.dylib+0xa7112c]  VMThread::run()+0xcc
V  [libjvm.dylib+0x9e7b5c]  Thread::call_run()+0xc8
V  [libjvm.dylib+0x8180e0]  thread_native_entry(Thread*)+0x118
C  [libsystem_pthread.dylib+0x6fa8]  _pthread_start+0x94
VM_Operation (0x0000000170252d60): CleanClassLoaderDataMetaspaces, mode: safepoint, requested by thread 0x000000011480a400</code></pre></figure>

<h2 id="down-the-rabbit-hole">Down the rabbit hole</h2>

<p>Hm, apparently, there is another code path that deallocates <code class="language-plaintext highlighter-rouge">InstanceKlass</code> contents (and transitively the contained
methods) in addition to <code class="language-plaintext highlighter-rouge">ClassLoaderData::unload()</code>. It starts in <code class="language-plaintext highlighter-rouge">ClassLoaderDataGraph</code> and the method of interest is</p>

<figure class="highlight"><pre><code class="language-cpp" data-lang="cpp"><span class="kt">void</span> <span class="n">ClassLoaderDataGraph</span><span class="o">::</span><span class="n">clean_deallocate_lists</span><span class="p">(</span><span class="kt">bool</span> <span class="n">walk_previous_versions</span><span class="p">)</span> <span class="p">{</span>
  <span class="n">assert</span><span class="p">(</span><span class="n">SafepointSynchronize</span><span class="o">::</span><span class="n">is_at_safepoint</span><span class="p">(),</span> <span class="s">"must only be called at safepoint"</span><span class="p">);</span>
  <span class="n">uint</span> <span class="n">loaders_processed</span> <span class="o">=</span> <span class="mi">0</span><span class="p">;</span>
  <span class="k">for</span> <span class="p">(</span><span class="n">ClassLoaderData</span><span class="o">*</span> <span class="n">cld</span> <span class="o">=</span> <span class="n">_head</span><span class="p">;</span> <span class="n">cld</span> <span class="o">!=</span> <span class="nb">nullptr</span><span class="p">;</span> <span class="n">cld</span> <span class="o">=</span> <span class="n">cld</span><span class="o">-&gt;</span><span class="n">next</span><span class="p">())</span> <span class="p">{</span>
    <span class="c1">// is_alive check will be necessary for concurrent class unloading.</span>
<span class="o">&gt;&gt;&gt;</span> <span class="k">if</span> <span class="p">(</span><span class="n">cld</span><span class="o">-&gt;</span><span class="n">is_alive</span><span class="p">())</span> <span class="p">{</span> <span class="o">&lt;&lt;&lt;&lt;</span>
      <span class="c1">// clean metaspace</span>
      <span class="k">if</span> <span class="p">(</span><span class="n">walk_previous_versions</span><span class="p">)</span> <span class="p">{</span>
        <span class="n">cld</span><span class="o">-&gt;</span><span class="n">classes_do</span><span class="p">(</span><span class="n">InstanceKlass</span><span class="o">::</span><span class="n">purge_previous_versions</span><span class="p">);</span>
      <span class="p">}</span>
      <span class="n">cld</span><span class="o">-&gt;</span><span class="n">free_deallocate_list</span><span class="p">();</span>
      <span class="n">loaders_processed</span><span class="o">++</span><span class="p">;</span>
    <span class="p">}</span>
  <span class="p">}</span>
  <span class="n">log_debug</span><span class="p">(</span><span class="k">class</span><span class="p">,</span> <span class="n">loader</span><span class="p">,</span> <span class="n">data</span><span class="p">)(</span><span class="s">"clean_deallocate_lists: loaders processed %u %s"</span><span class="p">,</span>
                                 <span class="n">loaders_processed</span><span class="p">,</span> <span class="n">walk_previous_versions</span> <span class="o">?</span> <span class="s">"walk_previous_versions"</span> <span class="o">:</span> <span class="s">""</span><span class="p">);</span>
<span class="p">}</span></code></pre></figure>

<p>Yes! The methods are being deallocated for a class loader that is still alive. Therefore, the code taking care of
all <code class="language-plaintext highlighter-rouge">jmmethodids</code> associated with this class loader is not called, and any deallocated method has the potential to leave
a dangling pointer in the corresponding <code class="language-plaintext highlighter-rouge">jmethodid</code> value.</p>

<h2 id="lets-fix-it">Let’s fix it!</h2>

<p>Good, it seems like the fix is trivial. Let’s just do this</p>

<figure class="highlight"><pre><code class="language-cpp" data-lang="cpp"><span class="kt">void</span> <span class="n">InstanceKlass</span><span class="o">::</span><span class="n">deallocate_methods</span><span class="p">(</span><span class="n">ClassLoaderData</span><span class="o">*</span> <span class="n">loader_data</span><span class="p">,</span>
                                       <span class="n">Array</span><span class="o">&lt;</span><span class="n">Method</span><span class="o">*&gt;*</span> <span class="n">methods</span><span class="p">)</span> <span class="p">{</span>
  <span class="k">if</span> <span class="p">(</span><span class="n">methods</span> <span class="o">!=</span> <span class="nb">nullptr</span> <span class="o">&amp;&amp;</span> <span class="n">methods</span> <span class="o">!=</span> <span class="n">Universe</span><span class="o">::</span><span class="n">the_empty_method_array</span><span class="p">()</span> <span class="o">&amp;&amp;</span>
      <span class="o">!</span><span class="n">methods</span><span class="o">-&gt;</span><span class="n">is_shared</span><span class="p">())</span> <span class="p">{</span>
    <span class="k">for</span> <span class="p">(</span><span class="kt">int</span> <span class="n">i</span> <span class="o">=</span> <span class="mi">0</span><span class="p">;</span> <span class="n">i</span> <span class="o">&lt;</span> <span class="n">methods</span><span class="o">-&gt;</span><span class="n">length</span><span class="p">();</span> <span class="n">i</span><span class="o">++</span><span class="p">)</span> <span class="p">{</span>
      <span class="n">Method</span><span class="o">*</span> <span class="n">method</span> <span class="o">=</span> <span class="n">methods</span><span class="o">-&gt;</span><span class="n">at</span><span class="p">(</span><span class="n">i</span><span class="p">);</span>
      <span class="k">if</span> <span class="p">(</span><span class="n">method</span> <span class="o">==</span> <span class="nb">nullptr</span><span class="p">)</span> <span class="k">continue</span><span class="p">;</span>  <span class="c1">// maybe null if error processing</span>
      <span class="c1">// Only want to delete methods that are not executing for RedefineClasses.</span>
      <span class="c1">// The previous version will point to them so they're not totally dangling</span>
      <span class="n">assert</span> <span class="p">(</span><span class="o">!</span><span class="n">method</span><span class="o">-&gt;</span><span class="n">on_stack</span><span class="p">(),</span> <span class="s">"shouldn't be called with methods on stack"</span><span class="p">);</span>

      <span class="n">jmethodID</span> <span class="n">jmid</span> <span class="o">=</span> <span class="n">method</span><span class="o">-&gt;</span><span class="n">find_jmethod_id_or_null</span><span class="p">();</span>
      <span class="c1">// Do the pointer maintenance before releasing the metadata, just in case</span>
      <span class="c1">// We need to make sure that jmethodID actually resolves to this method</span>
      <span class="c1">// - multiple redefined versions may share jmethodID slots and if a method</span>
      <span class="c1">//   has already been rewired to a newer version we could be removing reference</span>
      <span class="c1">//   to a still existing method instance</span>
      <span class="k">if</span> <span class="p">(</span><span class="n">jmid</span> <span class="o">!=</span> <span class="nb">nullptr</span> <span class="o">&amp;&amp;</span> <span class="o">*</span><span class="p">((</span><span class="n">Method</span><span class="o">**</span><span class="p">)</span><span class="n">jmid</span><span class="p">)</span> <span class="o">==</span> <span class="n">method</span><span class="p">)</span> <span class="p">{</span>
        <span class="c1">// dangling pointer; needs to be cleaned up</span>
        <span class="o">*</span><span class="p">((</span><span class="n">Method</span><span class="o">**</span><span class="p">)</span><span class="n">jmid</span><span class="p">)</span> <span class="o">=</span> <span class="nb">nullptr</span><span class="p">;</span>
      <span class="p">}</span>
      <span class="n">MetadataFactory</span><span class="o">::</span><span class="n">free_metadata</span><span class="p">(</span><span class="n">loader_data</span><span class="p">,</span> <span class="n">method</span><span class="p">);</span>
    <span class="p">}</span>
    <span class="n">MetadataFactory</span><span class="o">::</span><span class="n">free_array</span><span class="o">&lt;</span><span class="n">Method</span><span class="o">*&gt;</span><span class="p">(</span><span class="n">loader_data</span><span class="p">,</span> <span class="n">methods</span><span class="p">);</span>
  <span class="p">}</span>
<span class="p">}</span></code></pre></figure>

<p>And we are done. Honestly, I can’t believe the fix was so easy. I just had to update the <code class="language-plaintext highlighter-rouge">jmethodID</code> value to not point
to <code class="language-plaintext highlighter-rouge">Method</code> instances that are known to be deallocated shortly.</p>

<h2 id="what-is-the-real-cause">What is the real cause?</h2>

<p>As you probably expect, I left out a lot of wrong turns I took while investigating. Although not leading to the fix, they helped me understand the underlying cause, which is the class redefinition/retransformation. Do you remember <code class="language-plaintext highlighter-rouge">InstanceKlass::purge_previous_versions</code> from the failed guarantee stack trace? The ‘previous versions’ are older forms of redefined classes when some of the methods of those classes were running at the time they were redefined, and because of that, the JVM had to keep them around for a while. Then, from time to time, the JVM will check if it is possible to unload those class versions.</p>

<p>The tricky part is that the JVM will keep the <code class="language-plaintext highlighter-rouge">jmethodID</code> cache only in the ‘main’ class version, dynamically extending the cache to accommodate <code class="language-plaintext highlighter-rouge">jmethodID</code> values from obsolete but yet still active class versions. This can happen, e.g., when a class is redefined, the previous version is marked obsolete, but there are still some of its methods somewhere on the stack, and at that moment, we call <code class="language-plaintext highlighter-rouge">GetStackTrace</code>. New <code class="language-plaintext highlighter-rouge">jmethodID</code> values will be generated as required, and they will be placed in the <code class="language-plaintext highlighter-rouge">jmethodID</code> cache in the main version.</p>

<p>And here come the giggles - after an older class version has been purged, the <code class="language-plaintext highlighter-rouge">jmethodID</code> values are still present in the main class version cache but pointing to deallocated <code class="language-plaintext highlighter-rouge">Method</code> instances!</p>

<p>Ok, now the loop is closed, and I am pretty sure the proposed fix is correct and actually addresses the root cause.</p>

<h2 id="there-is-still-more-to-it">There is still more to it</h2>

<p>The way <code class="language-plaintext highlighter-rouge">jmethodID</code> values are stored for previous versions of a retransformed class also opens a whole new can of worms - requesting a <code class="language-plaintext highlighter-rouge">jmethodID</code> for an older method version may lead to cache resizing, which in turn will cause memory allocation. And remember, doing memory allocations in signal handlers is bad, mmkay? How is CPU and wallclock profiling generally done? Well, glad you asked - it’s by sending a signal to the JVM and letting the signal handler call <code class="language-plaintext highlighter-rouge">AsyncGetCallTrace</code>, which returns a stack trace comprised of, drumroll please, <code class="language-plaintext highlighter-rouge">jmethodID</code> values.</p>

<p>Sensible JVM profiler implementations try to avoid <code class="language-plaintext highlighter-rouge">jmethodID</code> cache resizes by eagerly requesting all the <code class="language-plaintext highlighter-rouge">jmethodID</code> values for all methods in the class upon class load. However, this strategy won’t work if the cache is resized because a previous method version <code class="language-plaintext highlighter-rouge">jmethodID</code> is requested.</p>

<p>Honestly, I don’t have a good solution for this yet. It might take some time to figure out how to address this issue.</p>

<h3 id="diagram-time">Diagram time</h3>

<p>For posterity, I am adding the schematic diagrams about how the <code class="language-plaintext highlighter-rouge">jmethodID</code> cache is organized for a redefined class.</p>

<p><em>Fig1: Overview of the jmethodID storage</em>
<img src="/assets/images/2023-11-13-mysterious-jmethodid/Overview.png" alt="jmethodID cache overview" /></p>

<p><em>Fig2: How the jmethodIDs are stored for a redefined class</em>
<img src="/assets/images/2023-11-13-mysterious-jmethodid/Redefined Classes.png" alt="jmethodID for redefined classes" /></p>

<h1 id="next-steps">Next steps</h1>

<p>The next steps would be trying to create a JTREG test for the fix. I will have to look around for tests that involve class redefinitions with several versions of a redefined class. Additionally, I need to find other tests that trigger metaspace cleanup. This way, I can combine them to trigger the problematic behavior. However, if this turns out to be too complicated, I would rather propose the fix and aim to get it into the upcoming JDK updates as soon as possible.</p>]]></content><author><name></name></author><category term="java" /><category term="jvm" /><category term="openjdk" /><category term="native" /><summary type="html"><![CDATA[]]></summary></entry></feed>